| Open: | 34.76 |
| Change: | -0.46 |
| Volume: | 45,561,576 |
| Low: | 33.89 |
| High: | 36.09 |
| High / Low range: | 2.20 |
| Type: | Stocks |
| Ticker: | SMCI |
| ISIN: |
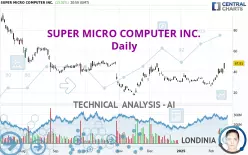
SUPER MICRO COMPUTER INC. - Daily - Technical analysis published on 02/18/2025 (GMT)
- 148
- 0
- 02/18/2025 - 12:22
Click here for a new analysis!
- Timeframe : Daily
- - Analysis generated on 02/18/2025 - 12:22
- Status : TARGET REACHED

Summary of the analysis

Additional analysis
Quotes
The SUPER MICRO COMPUTER INC. price is 47.91 USD. On the day, this instrument gained +13.32% and was traded between 42.85 USD and 48.18 USD over the period. The price is currently at +11.81% from its lowest and -0.56% from its highest.The Central Gaps scanner detects a bullish opening marking the presence of buyers ahead of sellers at the opening but not sufficiently marked to allow the price to register a quotation gap.
Bullish opening
Type : Bullish
Timeframe : Openning
Here is a more detailed summary of the historical variations registered by SUPER MICRO COMPUTER INC.:
New HIGH record (1st january)
Type : Bullish
Timeframe : Weekly
New HIGH record (1 month)
Type : Bullish
Timeframe : Weekly
Technical
Technical analysis of SUPER MICRO COMPUTER INC. in Daily shows an overall bullish trend. 75.00% of the signals given by moving averages are bullish. The overall trend is reinforced by the strong bullish signals from short-term moving averages. The Central Indicators market scanner currently does not detect any result that concerns moving averages.
In fact, 16 technical indicators on 18 studied are currently positioned bullish. But beware of excesses. The Central Indicators scanner currently detects this:
RSI indicator is overbought : over 70
Type : Neutral
Timeframe : Daily
CCI indicator is overbought : over 100
Type : Neutral
Timeframe : Daily
Williams %R indicator is overbought : over -20
Type : Neutral
Timeframe : Daily
Pivot points : price is over resistance 2
Type : Neutral
Timeframe : Daily
Pivot points : price is over resistance 2
Type : Neutral
Timeframe : Weekly
Central Patterns, the scanner specializing in chart patterns, did not identify any signals.
The Central Candlesticks scanner, specialised in Japanese candlesticks, did not identify any signals.
| S3 | S2 | S1 | Price | R1 | R2 | R3 | |
|---|---|---|---|---|---|---|---|
| ProTrendLines | 18.01 | 26.85 | 35.33 | 47.91 | 49.12 | 62.88 | 71.37 |
| Change (%) | -62.41% | -43.96% | -26.26% | - | +2.53% | +31.25% | +48.97% |
| Change | -29.90 | -21.06 | -12.58 | - | +1.21 | +14.97 | +23.46 |
| Level | Intermediate | Major | Intermediate | - | Intermediate | Minor | Intermediate |
To determine price objectives, it is also possible to use the pivot points. Here is the price position in relation to pivot points:
| Pivot points | S3 | S2 | S1 | PP | R1 | R2 | R3 |
|---|---|---|---|---|---|---|---|
| Standard | 39.12 | 40.98 | 44.45 | 46.31 | 49.78 | 51.64 | 55.11 |
| Camarilla | 46.44 | 46.93 | 47.42 | 47.91 | 48.40 | 48.89 | 49.38 |
| Woodie | 39.92 | 41.38 | 45.25 | 46.71 | 50.58 | 52.04 | 55.91 |
| Fibonacci | 40.98 | 43.02 | 44.28 | 46.31 | 48.35 | 49.61 | 51.64 |
| Pivot points | S3 | S2 | S1 | PP | R1 | R2 | R3 |
|---|---|---|---|---|---|---|---|
| Standard | 17.76 | 21.73 | 29.01 | 32.98 | 40.26 | 44.23 | 51.51 |
| Camarilla | 33.19 | 34.22 | 35.25 | 36.28 | 37.31 | 38.34 | 39.37 |
| Woodie | 19.41 | 22.56 | 30.66 | 33.81 | 41.91 | 45.06 | 53.16 |
| Fibonacci | 21.73 | 26.03 | 28.69 | 32.98 | 37.28 | 39.94 | 44.23 |
| Pivot points | S3 | S2 | S1 | PP | R1 | R2 | R3 |
|---|---|---|---|---|---|---|---|
| Standard | 13.05 | 20.13 | 24.33 | 31.41 | 35.61 | 42.69 | 46.89 |
| Camarilla | 25.42 | 26.45 | 27.49 | 28.52 | 29.55 | 30.59 | 31.62 |
| Woodie | 11.60 | 19.41 | 22.88 | 30.69 | 34.16 | 41.97 | 45.44 |
| Fibonacci | 20.13 | 24.44 | 27.10 | 31.41 | 35.72 | 38.38 | 42.69 |
Numerical data
The following is the status of the technical indicators and moving averages at the time of publication of this technical analysis:
| RSI (14): | 71.93 | |
| MACD (12,26,9): | 2.7400 | |
| Directional Movement: | 27.79 | |
| AROON (14): | 64.29 | |
| DEMA (21): | 38.50 | |
| Parabolic SAR (0,02-0,02-0,2): | 30.61 | |
| Elder Ray (13): | 8.06 | |
| Super Trend (3,10): | 34.14 | |
| Zig ZAG (10): | 47.91 | |
| VORTEX (21): | 1.1400 | |
| Stochastique (14,3,5): | 89.77 | |
| TEMA (21): | 41.46 | |
| Williams %R (14): | -1.20 | |
| Chande Momentum Oscillator (20): | 20.11 | |
| Repulse (5,40,3): | 18.3200 | |
| ROCnROLL: | 1 | |
| TRIX (15,9): | 0.3400 | |
| Courbe Coppock: | 60.20 |
| MA7: | 40.18 | |
| MA20: | 33.74 | |
| MA50: | 34.37 | |
| MA100: | 35.87 | |
| MAexp7: | 40.53 | |
| MAexp20: | 35.79 | |
| MAexp50: | 34.71 | |
| MAexp100: | 39.03 | |
| Price / MA7: | +19.24% | |
| Price / MA20: | +42.00% | |
| Price / MA50: | +39.39% | |
| Price / MA100: | +33.57% | |
| Price / MAexp7: | +18.21% | |
| Price / MAexp20: | +33.86% | |
| Price / MAexp50: | +38.03% | |
| Price / MAexp100: | +22.75% |
News
Don't forget to follow the news on SUPER MICRO COMPUTER INC.. At the time of publication of this analysis, the latest news was as follows:
- 10/05/2018 - 00:05 Kaskela Law LLC Announces Investigation of Super Micro Computer, Inc. and Encourages Investors with Financial Losses in Excess of $500,000 to Contact the Firm - SMCI
- 08/20/2018 - 15:00 "Mission: Green Computing" by Supermicro Introduces Total Cost to the Environment (TCE) for Leading Data Centers
- 08/16/2018 - 12:15 Investor Expectations to Drive Momentum within Global Medical REIT, Cyclacel Pharmaceuticals, Super Micro Computer, Kelly Services, Invitae, and ScanSource — Discovering Underlying Factors of Influence
- 08/07/2018 - 15:00 Supermicro Opens New Era of Petascale Computing with a Family of All-Flash NVMe 1U Systems Scalable up to a Petabyte of High Performance Storage
- 07/23/2018 - 13:00 Supermicro Joins Board of the Storage Networking Industry Association to Accelerate All-Flash NVMe Storage Advancements and Adoption
About author

Online


Add a comment
Comments
0 comments on the analysis SUPER MICRO COMPUTER INC. - Daily