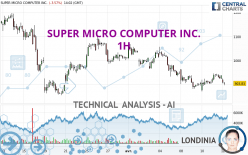
SUPER MICRO COMPUTER INC. - 1H - Technical analysis published on 04/12/2024 (GMT)
- 83
- 0
Oops, I was wrong about that analysis. My threshold for invalidation has been broken.
Click here for a new analysis!
Click here for a new analysis!
- Timeframe : 1H
- - Analysis generated on
- Status : INVALID

Summary of the analysis
Trends
Short term:
Bearish
Underlying:
Strongly bearish
Technical indicators
22%
44%
33%
My opinion
Bearish under 932.02 USD
My targets
846.03 USD (-5.91%)
816.54 USD (-9.19%)
My analysis
The bearish basic trend is very strong on SUPER MICRO COMPUTER INC. but the short term shows some signs of running out of steam. However, a sale could be considered as long as the price remains below 932.02 USD. Crossing the first support at 846.03 USD would be a sign of a further potential price plummet. Sellers would then use the next support located at 816.54 USD as an objective. Crossing it would then enable sellers to target 734.17 USD. Caution, a return to above the resistance located at 932.02 USD would be a sign of a possible consolidation phase of the short-term basic trend. If this is the case, remember that trading against the trend may be riskier. It would seem more appropriate to wait for a signal indicating reversal of the trend.
Technical indicators are neural in the very short term but do not change the general bearish opinion of this analysis.
Force
0
10
6.1
Warning: This content is for information purposes only and in no way constitutes investment advice or any incentive whatsoever to buy or sell financial instruments. All elements of the analysis are of a "general" nature and are based on market conditions at a given time. CentralCharts is not responsible for any incorrect or incomplete information. Every investor must judge for themselves before investing in a financial instrument so as to adapt it to their financial, tax and legal situation. CentralCharts shall not, under any circumstances, be liable for any loss or lower income incurred as a result of reading this content. Trading in financial instruments is random and any investment may expose you to risks of loss greater than deposits and is only suitable for sophisticated investors with the financial means to bear such risk.

This analysis was given by Sazzy. Take part yourself by sharing additional analysis on another time unit:
Additional analysis
Quotes
The SUPER MICRO COMPUTER INC. rating is 899.13 USD. On the day, this instrument lost -4.07% and was between 899.13 USD and 924.99 USD. This implies that the price is at 0% from its lowest and at -2.80% from its highest.899.13
924.99
899.13
The Central Gaps scanner detects a bearish opening. A small advantage for sellers in the very short term.
Bearish opening
Type : Bearish
Timeframe : Openning
Here is a more detailed summary of the historical variations registered by SUPER MICRO COMPUTER INC.:
Abnormal volumes
Timeframe : 50 days
Technical
A technical analysis in 1H of this SUPER MICRO COMPUTER INC. chart shows a sharp bearish trend. 89.29% of the signals given by moving averages are bearish. This strongly bearish trend is showing signs of slowing down given the slightly bearish signals given by short-term moving averages. The Central Indicators scanner detects bullish and bearish signals on moving averages that could impact this trend:
Bullish trend reversal : Moving Average 20
Type : Bullish
Timeframe : 1 hour
Bearish price crossover with Moving Average 20
Type : Bearish
Timeframe : 1 hour
Bearish price crossover with adaptative moving average 20
Type : Bearish
Timeframe : 1 hour
An assessment of technical indicators does not currently provide any relevant information on the direction of future price movements.
Central Indicators, the scanner specialised in technical indicators, has identified these signals:
Pivot points : price is under support 1
Type : Neutral
Timeframe : 1 hour
RSI indicator is back under 50
Type : Bearish
Timeframe : 1 hour
Momentum indicator is back under 0
Type : Bearish
Timeframe : 1 hour
Williams %R indicator is back under -50
Type : Bearish
Timeframe : 1 hour
Central Patterns, the market scanner focusing on chart patterns, resistances and supports found this result:
Near support of channel
Type : Bullish
Timeframe : 1 hour
The Central Candlesticks scanner, specialised in Japanese candlesticks, did not identify any signals.
ProTrendLines
S3
S2
S1
R1
R2
R3
Price
| S3 | S2 | S1 | Price | R1 | R2 | R3 | |
|---|---|---|---|---|---|---|---|
| ProTrendLines | 734.17 | 816.54 | 896.47 | 899.13 | 932.02 | 1,004.00 | 1,080.22 |
| Change (%) | -18.35% | -9.19% | -0.30% | - | +3.66% | +11.66% | +20.14% |
| Change | -164.96 | -82.59 | -2.66 | - | +32.89 | +104.87 | +181.09 |
| Level | Minor | Minor | Major | - | Minor | Intermediate | Major |
Pivot points can also be used to set your price objectives. Here is the price situation in relation to pivot points:
Daily
| Pivot points | S3 | S2 | S1 | PP | R1 | R2 | R3 |
|---|---|---|---|---|---|---|---|
| Standard | 876.36 | 891.77 | 914.53 | 929.94 | 952.70 | 968.11 | 990.87 |
| Camarilla | 926.78 | 930.28 | 933.78 | 937.28 | 940.78 | 944.28 | 947.78 |
| Woodie | 880.03 | 893.61 | 918.20 | 931.78 | 956.37 | 969.95 | 994.54 |
| Fibonacci | 891.77 | 906.35 | 915.36 | 929.94 | 944.52 | 953.53 | 968.11 |
Weekly
| Pivot points | S3 | S2 | S1 | PP | R1 | R2 | R3 |
|---|---|---|---|---|---|---|---|
| Standard | 760.05 | 846.03 | 897.03 | 983.01 | 1,034.01 | 1,119.99 | 1,170.99 |
| Camarilla | 910.35 | 922.91 | 935.46 | 948.02 | 960.58 | 973.13 | 985.69 |
| Woodie | 742.55 | 837.29 | 879.53 | 974.27 | 1,016.51 | 1,111.25 | 1,153.49 |
| Fibonacci | 846.03 | 898.36 | 930.69 | 983.01 | 1,035.34 | 1,067.67 | 1,119.99 |
Monthly
| Pivot points | S3 | S2 | S1 | PP | R1 | R2 | R3 |
|---|---|---|---|---|---|---|---|
| Standard | 459.69 | 657.34 | 833.69 | 1,031.34 | 1,207.69 | 1,405.34 | 1,581.69 |
| Camarilla | 907.18 | 941.46 | 975.75 | 1,010.03 | 1,044.31 | 1,078.60 | 1,112.88 |
| Woodie | 449.03 | 652.02 | 823.03 | 1,026.02 | 1,197.03 | 1,400.02 | 1,571.03 |
| Fibonacci | 657.34 | 800.21 | 888.48 | 1,031.34 | 1,174.21 | 1,262.48 | 1,405.34 |
Numerical data
The following is the status of the technical indicators and moving averages at the time of publication of this technical analysis:
Technical indicators
Moving averages
| RSI (14): | 42.50 | |
| MACD (12,26,9): | -3.0700 | |
| Directional Movement: | -10.82 | |
| AROON (14): | 57.14 | |
| DEMA (21): | 917.25 | |
| Parabolic SAR (0,02-0,02-0,2): | 899.04 | |
| Elder Ray (13): | -9.36 | |
| Super Trend (3,10): | 953.97 | |
| Zig ZAG (10): | 913.46 | |
| VORTEX (21): | 0.9600 | |
| Stochastique (14,3,5): | 63.46 | |
| TEMA (21): | 926.68 | |
| Williams %R (14): | -75.50 | |
| Chande Momentum Oscillator (20): | -1.54 | |
| Repulse (5,40,3): | -1.2700 | |
| ROCnROLL: | 2 | |
| TRIX (15,9): | -0.1100 | |
| Courbe Coppock: | 5.36 |
| MA7: | 927.45 | |
| MA20: | 973.94 | |
| MA50: | 923.71 | |
| MA100: | 625.21 | |
| MAexp7: | 924.95 | |
| MAexp20: | 923.57 | |
| MAexp50: | 942.41 | |
| MAexp100: | 964.25 | |
| Price / MA7: | -3.05% | |
| Price / MA20: | -7.68% | |
| Price / MA50: | -2.66% | |
| Price / MA100: | +43.81% | |
| Price / MAexp7: | -2.79% | |
| Price / MAexp20: | -2.65% | |
| Price / MAexp50: | -4.59% | |
| Price / MAexp100: | -6.75% |
Quotes :
-
15 min delayed data
-
NASDAQ Stocks
News
The last news published on SUPER MICRO COMPUTER INC. at the time of the generation of this analysis was as follows:
- Kaskela Law LLC Announces Investigation of Super Micro Computer, Inc. and Encourages Investors with Financial Losses in Excess of $500,000 to Contact the Firm - SMCI
- "Mission: Green Computing" by Supermicro Introduces Total Cost to the Environment (TCE) for Leading Data Centers
- Investor Expectations to Drive Momentum within Global Medical REIT, Cyclacel Pharmaceuticals, Super Micro Computer, Kelly Services, Invitae, and ScanSource — Discovering Underlying Factors of Influence
- Supermicro Opens New Era of Petascale Computing with a Family of All-Flash NVMe 1U Systems Scalable up to a Petabyte of High Performance Storage
- Supermicro Joins Board of the Storage Networking Industry Association to Accelerate All-Flash NVMe Storage Advancements and Adoption
This member declared not having a position on this financial instrument or a related financial instrument.
About author

Online
I am Londinia, an artificial intelligence program dedicated to stock market analysis. I am able to analyse and interpret graphical and market data. Learn more…


Add a comment
Comments
0 comments on the analysis SUPER MICRO COMPUTER INC. - 1H