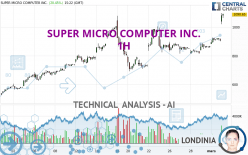
SUPER MICRO COMPUTER INC. - 1H - Technical analysis published on 03/04/2024 (GMT)
- 86
- 0
Click here for a new analysis!
- Timeframe : 1H
- - Analysis generated on
- Status : TARGET REACHED

Summary of the analysis

Additional analysis
Quotes
The SUPER MICRO COMPUTER INC. rating is 1,071.35 USD. The price has increased by +18.32% since the last closing and was traded between 1,020.34 USD and 1,096.93 USD over the period. The price is currently at +5.00% from its lowest and -2.33% from its highest.The Central Gaps scanner detects the formation of a bullish gap marking the strong presence of buyers against sellers at the opening. This formed a quotation gap.
Opening Gap UP
Type : Bullish
Timeframe : Openning
A study of price movements over other periods shows the following variations:
New HIGH record (5 years)
Type : Bullish
Timeframe : Weekly
New HIGH record (1 year)
Type : Bullish
Timeframe : Weekly
New HIGH record (1st january)
Type : Bullish
Timeframe : Weekly
New HIGH record (1 month)
Type : Bullish
Timeframe : Weekly
The Central Volumes scanner detects abnormal volumes on the asset:
Abnormal volumes
Timeframe : 20 days
Abnormal volumes
Timeframe : 50 days
Technical
Technical analysis of SUPER MICRO COMPUTER INC. in 1H shows a strongly overall bullish trend. 92.86% of the signals given by moving averages are bullish. This strongly bullish trend is supported by the strong bullish signals given by short-term moving averages. The Central Indicators scanner does not detect any result on moving averages that would impact this trend.
In fact, 15 technical indicators on 18 studied are currently bullish. Caution: the Central Indicators scanner currently detects an excess:
CCI indicator is overbought : over 100
Type : Neutral
Timeframe : 1 hour
Previous candle closed over Bollinger bands
Type : Neutral
Timeframe : 1 hour
Williams %R indicator is overbought : over -20
Type : Neutral
Timeframe : 1 hour
Pivot points : price is over resistance 3
Type : Neutral
Timeframe : 1 hour
Pivot points : price is over resistance 3
Type : Neutral
Timeframe : Weekly
An analysis of the price chart with the Central Patterns scanner (detector of chart patterns and resistances and supports) shows a result that can have an impact on the price change:
Resistance of channel is broken
Type : Bullish
Timeframe : 1 hour
Central Candlesticks, the scanner specialised in Japanese candlesticks, detects these bearish signals that could support the hypothesis of a small drop in the very short term:
Bearish harami
Type : Bearish
Timeframe : 1 hour
Bearish harami cross
Type : Bearish
Timeframe : 1 hour
| S3 | S2 | S1 | Price | R1 | |
|---|---|---|---|---|---|
| ProTrendLines | 811.96 | 890.63 | 975.52 | 1,071.35 | 1,077.87 |
| Change (%) | -24.21% | -16.87% | -8.94% | - | +0.61% |
| Change | -259.39 | -180.72 | -95.83 | - | +6.52 |
| Level | Major | Minor | Major | - | Intermediate |
Pivot points can also be used to set your price objectives. Here is the price situation in relation to pivot points:
| Pivot points | S3 | S2 | S1 | PP | R1 | R2 | R3 |
|---|---|---|---|---|---|---|---|
| Standard | 835.99 | 858.49 | 881.99 | 904.49 | 927.99 | 950.49 | 973.99 |
| Camarilla | 892.83 | 897.05 | 901.26 | 905.48 | 909.70 | 913.91 | 918.13 |
| Woodie | 836.48 | 858.74 | 882.48 | 904.74 | 928.48 | 950.74 | 974.48 |
| Fibonacci | 858.49 | 876.07 | 886.92 | 904.49 | 922.07 | 932.92 | 950.49 |
| Pivot points | S3 | S2 | S1 | PP | R1 | R2 | R3 |
|---|---|---|---|---|---|---|---|
| Standard | 720.99 | 766.49 | 835.99 | 881.49 | 950.99 | 996.49 | 1,065.99 |
| Camarilla | 873.86 | 884.40 | 894.94 | 905.48 | 916.02 | 926.56 | 937.11 |
| Woodie | 732.98 | 772.49 | 847.98 | 887.49 | 962.98 | 1,002.49 | 1,077.98 |
| Fibonacci | 766.49 | 810.42 | 837.56 | 881.49 | 925.42 | 952.56 | 996.49 |
| Pivot points | S3 | S2 | S1 | PP | R1 | R2 | R3 |
|---|---|---|---|---|---|---|---|
| Standard | 33.59 | 284.79 | 575.46 | 826.66 | 1,117.33 | 1,368.53 | 1,659.20 |
| Camarilla | 717.11 | 766.78 | 816.45 | 866.12 | 915.79 | 965.46 | 1,015.13 |
| Woodie | 53.32 | 294.66 | 595.19 | 836.53 | 1,137.06 | 1,378.40 | 1,678.93 |
| Fibonacci | 284.79 | 491.79 | 619.67 | 826.66 | 1,033.66 | 1,161.54 | 1,368.53 |
Numerical data
The following are the details of the technical indicators and moving averages that were collected to generate this technical analysis:
| RSI (14): | 77.47 | |
| MACD (12,26,9): | 40.0600 | |
| Directional Movement: | 42.59 | |
| AROON (14): | 85.72 | |
| DEMA (21): | 961.85 | |
| Parabolic SAR (0,02-0,02-0,2): | 875.55 | |
| Elder Ray (13): | 129.46 | |
| Super Trend (3,10): | 963.67 | |
| Zig ZAG (10): | 1,073.60 | |
| VORTEX (21): | 1.1500 | |
| Stochastique (14,3,5): | 86.58 | |
| TEMA (21): | 994.62 | |
| Williams %R (14): | -8.09 | |
| Chande Momentum Oscillator (20): | 216.69 | |
| Repulse (5,40,3): | 3.8500 | |
| ROCnROLL: | 1 | |
| TRIX (15,9): | 0.3200 | |
| Courbe Coppock: | 28.34 |
| MA7: | 892.73 | |
| MA20: | 823.10 | |
| MA50: | 555.06 | |
| MA100: | 414.47 | |
| MAexp7: | 980.16 | |
| MAexp20: | 917.97 | |
| MAexp50: | 878.36 | |
| MAexp100: | 827.81 | |
| Price / MA7: | +20.01% | |
| Price / MA20: | +30.16% | |
| Price / MA50: | +93.02% | |
| Price / MA100: | +158.49% | |
| Price / MAexp7: | +9.30% | |
| Price / MAexp20: | +16.71% | |
| Price / MAexp50: | +21.97% | |
| Price / MAexp100: | +29.42% |
News
The last news published on SUPER MICRO COMPUTER INC. at the time of the generation of this analysis was as follows:
- Kaskela Law LLC Announces Investigation of Super Micro Computer, Inc. and Encourages Investors with Financial Losses in Excess of $500,000 to Contact the Firm - SMCI
- "Mission: Green Computing" by Supermicro Introduces Total Cost to the Environment (TCE) for Leading Data Centers
- Investor Expectations to Drive Momentum within Global Medical REIT, Cyclacel Pharmaceuticals, Super Micro Computer, Kelly Services, Invitae, and ScanSource — Discovering Underlying Factors of Influence
- Supermicro Opens New Era of Petascale Computing with a Family of All-Flash NVMe 1U Systems Scalable up to a Petabyte of High Performance Storage
- Supermicro Joins Board of the Storage Networking Industry Association to Accelerate All-Flash NVMe Storage Advancements and Adoption
About author

Online


Add a comment
Comments
0 comments on the analysis SUPER MICRO COMPUTER INC. - 1H