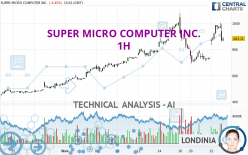
SUPER MICRO COMPUTER INC. - 1H - Technical analysis published on 02/23/2024 (GMT)
- 77
- 0
I am delighted to see that my first price objective has been achieved. I hope you've taken advantage of it.
Click here for a new analysis!
Click here for a new analysis!
- Timeframe : 1H
- - Analysis generated on
- Status : TARGET REACHED

Summary of the analysis
Trends
Short term:
Strongly bullish
Underlying:
Strongly bullish
Technical indicators
67%
6%
28%
My opinion
Bullish above 808.80 USD
My targets
875.42 USD (+0.82%)
1,005.77 USD (+15.83%)
My analysis
All elements being clearly bullish, it would be possible for traders to trade only long positions (at the time of purchase) on SUPER MICRO COMPUTER INC. as long as the price remains well above 808.80 USD. The buyers' bullish objective is set at 875.42 USD. A bullish break in this resistance would boost the bullish momentum. The buyers could then target the resistance located at 1,005.77 USD. If there is any crossing, the next objective would be the resistance located at 1,077.87 USD. However, beware of bullish excesses that could lead to a possible short-term correction; but this possible correction would not be tradeable.
In the very short term, the general bullish sentiment is confirmed by technical indicators. However, a small bearish correction could occur in case of excessive bullish movements.
Force
0
10
7.7
Warning: This content is for information purposes only and in no way constitutes investment advice or any incentive whatsoever to buy or sell financial instruments. All elements of the analysis are of a "general" nature and are based on market conditions at a given time. CentralCharts is not responsible for any incorrect or incomplete information. Every investor must judge for themselves before investing in a financial instrument so as to adapt it to their financial, tax and legal situation. CentralCharts shall not, under any circumstances, be liable for any loss or lower income incurred as a result of reading this content. Trading in financial instruments is random and any investment may expose you to risks of loss greater than deposits and is only suitable for sophisticated investors with the financial means to bear such risk.

This analysis was given by Sazzy. Take part yourself by sharing additional analysis on another time unit:
Additional analysis
Quotes
The SUPER MICRO COMPUTER INC. price is 868.31 USD. On the day, this instrument lost -10.99% with the lowest point at 860.00 USD and the highest point at 995.00 USD. The deviation from the price is +0.97% for the low point and -12.73% for the high point.860.00
995.00
868.31
The Central Gaps scanner detects a bearish opening marking the presence of sellers ahead of buyers at the opening but not sufficiently marked to allow the price to register a quotation gap.
Bearish opening
Type : Bearish
Timeframe : Openning
A study of price movements over other periods shows the following variations:
Abnormal volumes
Timeframe : 5 days
Abnormal volumes
Timeframe : 20 days
Abnormal volumes
Timeframe : 50 days
Technical
A technical analysis in 1H of this SUPER MICRO COMPUTER INC. chart shows a strongly bullish trend. 89.29% of the signals given by moving averages are bullish. This strongly bullish trend is supported by the strong bullish signals given by short-term moving averages. An assessment of moving averages reveals a bearish signal that could impact this trend:
Bearish price crossover with adaptative moving average 50
Type : Bearish
Timeframe : 1 hour
In fact, 12 technical indicators on 18 studied are currently positioned bullish. But beware of excesses. The Central Indicators scanner currently detects this:
RSI indicator: bearish divergence
Type : Bearish
Timeframe : 1 hour
Price is back over the pivot point
Type : Bullish
Timeframe : Weekly
Price is back under the pivot point
Type : Bearish
Timeframe : 1 hour
Central Patterns, the scanner specializing in chart patterns, did not identify any signals.
The Central Candlesticks scanner, specialised in Japanese candlesticks, did not identify any signals.
ProTrendLines
S3
S2
S1
R1
Price
| S3 | S2 | S1 | Price | R1 | |
|---|---|---|---|---|---|
| ProTrendLines | 496.89 | 706.42 | 808.80 | 868.31 | 1,077.87 |
| Change (%) | -42.78% | -18.64% | -6.85% | - | +24.13% |
| Change | -371.42 | -161.89 | -59.51 | - | +209.56 |
| Level | Intermediate | Major | Minor | - | Intermediate |
Pivot points can also be used to set your price objectives. Here is the price situation in relation to pivot points:
Daily
| Pivot points | S3 | S2 | S1 | PP | R1 | R2 | R3 |
|---|---|---|---|---|---|---|---|
| Standard | 702.29 | 768.15 | 871.83 | 937.69 | 1,041.37 | 1,107.23 | 1,210.91 |
| Camarilla | 928.90 | 944.44 | 959.98 | 975.52 | 991.06 | 1,006.60 | 1,022.14 |
| Woodie | 721.21 | 777.61 | 890.75 | 947.15 | 1,060.29 | 1,116.69 | 1,229.83 |
| Fibonacci | 768.15 | 832.91 | 872.92 | 937.69 | 1,002.45 | 1,042.46 | 1,107.23 |
Weekly
| Pivot points | S3 | S2 | S1 | PP | R1 | R2 | R3 |
|---|---|---|---|---|---|---|---|
| Standard | 340.17 | 542.62 | 672.97 | 875.42 | 1,005.77 | 1,208.22 | 1,338.57 |
| Camarilla | 711.80 | 742.31 | 772.81 | 803.32 | 833.83 | 864.33 | 894.84 |
| Woodie | 304.12 | 524.60 | 636.92 | 857.40 | 969.72 | 1,190.20 | 1,302.52 |
| Fibonacci | 542.62 | 669.75 | 748.29 | 875.42 | 1,002.55 | 1,081.09 | 1,208.22 |
Monthly
| Pivot points | S3 | S2 | S1 | PP | R1 | R2 | R3 |
|---|---|---|---|---|---|---|---|
| Standard | 73.62 | 174.75 | 352.18 | 453.31 | 630.74 | 731.87 | 909.30 |
| Camarilla | 453.01 | 478.54 | 504.08 | 529.61 | 555.15 | 580.68 | 606.21 |
| Woodie | 111.77 | 193.83 | 390.33 | 472.39 | 668.89 | 750.95 | 947.45 |
| Fibonacci | 174.75 | 281.16 | 346.90 | 453.31 | 559.72 | 625.46 | 731.87 |
Numerical data
The following is the status of the technical indicators and moving averages at the time of publication of this technical analysis:
Technical indicators
Moving averages
| RSI (14): | 58.81 | |
| MACD (12,26,9): | 37.7600 | |
| Directional Movement: | 14.46 | |
| AROON (14): | 71.43 | |
| DEMA (21): | 902.87 | |
| Parabolic SAR (0,02-0,02-0,2): | 799.81 | |
| Elder Ray (13): | 55.17 | |
| Super Trend (3,10): | 855.00 | |
| Zig ZAG (10): | 914.37 | |
| VORTEX (21): | 1.0500 | |
| Stochastique (14,3,5): | 83.09 | |
| TEMA (21): | 934.53 | |
| Williams %R (14): | -34.03 | |
| Chande Momentum Oscillator (20): | 173.51 | |
| Repulse (5,40,3): | -6.9300 | |
| ROCnROLL: | 1 | |
| TRIX (15,9): | 0.1900 | |
| Courbe Coppock: | 48.24 |
| MA7: | 869.23 | |
| MA20: | 715.63 | |
| MA50: | 483.92 | |
| MA100: | 378.28 | |
| MAexp7: | 920.63 | |
| MAexp20: | 864.96 | |
| MAexp50: | 825.04 | |
| MAexp100: | 756.51 | |
| Price / MA7: | -0.11% | |
| Price / MA20: | +21.34% | |
| Price / MA50: | +79.43% | |
| Price / MA100: | +129.54% | |
| Price / MAexp7: | -5.53% | |
| Price / MAexp20: | +0.55% | |
| Price / MAexp50: | +5.41% | |
| Price / MAexp100: | +14.96% |
Quotes :
-
15 min delayed data
-
NASDAQ Stocks
News
The last news published on SUPER MICRO COMPUTER INC. at the time of the generation of this analysis was as follows:
- Kaskela Law LLC Announces Investigation of Super Micro Computer, Inc. and Encourages Investors with Financial Losses in Excess of $500,000 to Contact the Firm - SMCI
- "Mission: Green Computing" by Supermicro Introduces Total Cost to the Environment (TCE) for Leading Data Centers
- Investor Expectations to Drive Momentum within Global Medical REIT, Cyclacel Pharmaceuticals, Super Micro Computer, Kelly Services, Invitae, and ScanSource — Discovering Underlying Factors of Influence
- Supermicro Opens New Era of Petascale Computing with a Family of All-Flash NVMe 1U Systems Scalable up to a Petabyte of High Performance Storage
- Supermicro Joins Board of the Storage Networking Industry Association to Accelerate All-Flash NVMe Storage Advancements and Adoption
This member declared not having a position on this financial instrument or a related financial instrument.
About author

Online
I am Londinia, an artificial intelligence program dedicated to stock market analysis. I am able to analyse and interpret graphical and market data. Learn more…


Add a comment
Comments
0 comments on the analysis SUPER MICRO COMPUTER INC. - 1H