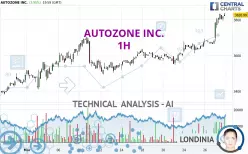
AUTOZONE INC. - 1H - Technical analysis published on 03/28/2025 (GMT)
- 101
- 0
- Timeframe : 1H
- - Analysis generated on
- Status : WITHOUT TARGET

Summary of the analysis

Additional analysis
Quotes
The AUTOZONE INC. rating is 3,828.11 USD. The price has increased by +3.98% since the last closing with the lowest point at 3,680.00 USD and the highest point at 3,838.00 USD. The deviation from the price is +4.02% for the low point and -0.26% for the high point.The Central Gaps scanner detects a bullish gap which is a sign that buyers have taken the lead in the very short term.
Opening Gap UP
Type : Bullish
Timeframe : Openning
A study of price movements over other periods shows the following variations:
New HIGH record (5 years)
Type : Bullish
Timeframe : Weekly
New HIGH record (1 year)
Type : Bullish
Timeframe : Weekly
New HIGH record (1st january)
Type : Bullish
Timeframe : Weekly
New HIGH record (1 month)
Type : Bullish
Timeframe : Weekly
Technical
Technical analysis of this 1H chart of AUTOZONE INC. indicates that the overall trend is strongly bullish. 92.86% of the signals given by moving averages are bullish. The overall trend is supported by the strong bullish signals from short-term moving averages. The Central Indicators scanner does not detect any result on moving averages that would impact this trend.
In fact, 14 technical indicators on 18 studied are currently bullish. Caution: the Central Indicators scanner currently detects an excess:
RSI indicator is overbought : over 70
Type : Neutral
Timeframe : 1 hour
CCI indicator is overbought : over 100
Type : Neutral
Timeframe : 1 hour
Williams %R indicator is overbought : over -20
Type : Neutral
Timeframe : 1 hour
Pivot points : price is over resistance 3 (Daily)
Type : Neutral
Timeframe : Weekly
The analysis of the price chart with Central Patterns scanners does not return any result.
No result was found by the Central Candlesticks scanner on Japanese candlesticks.
| S3 | S2 | S1 | Price | |
|---|---|---|---|---|
| ProTrendLines | 3,573.38 | 3,634.21 | 3,690.12 | 3,828.11 |
| Change (%) | -6.65% | -5.07% | -3.60% | - |
| Change | -254.73 | -193.90 | -137.99 | - |
| Level | Intermediate | Minor | Major | - |
Pivot points can also be used to set your price objectives. Here is the price situation in relation to pivot points:
| Pivot points | S3 | S2 | S1 | PP | R1 | R2 | R3 |
|---|---|---|---|---|---|---|---|
| Standard | 3,634.28 | 3,648.64 | 3,665.16 | 3,679.52 | 3,696.04 | 3,710.40 | 3,726.92 |
| Camarilla | 3,673.19 | 3,676.02 | 3,678.85 | 3,681.68 | 3,684.51 | 3,687.34 | 3,690.17 |
| Woodie | 3,635.36 | 3,649.18 | 3,666.24 | 3,680.06 | 3,697.12 | 3,710.94 | 3,728.00 |
| Fibonacci | 3,648.64 | 3,660.44 | 3,667.72 | 3,679.52 | 3,691.32 | 3,698.60 | 3,710.40 |
| Pivot points | S3 | S2 | S1 | PP | R1 | R2 | R3 |
|---|---|---|---|---|---|---|---|
| Standard | 3,471.61 | 3,509.71 | 3,558.02 | 3,596.12 | 3,644.43 | 3,682.53 | 3,730.84 |
| Camarilla | 3,582.58 | 3,590.50 | 3,598.42 | 3,606.34 | 3,614.26 | 3,622.18 | 3,630.10 |
| Woodie | 3,476.73 | 3,512.26 | 3,563.14 | 3,598.67 | 3,649.55 | 3,685.08 | 3,735.96 |
| Fibonacci | 3,509.71 | 3,542.72 | 3,563.11 | 3,596.12 | 3,629.13 | 3,649.52 | 3,682.53 |
| Pivot points | S3 | S2 | S1 | PP | R1 | R2 | R3 |
|---|---|---|---|---|---|---|---|
| Standard | 3,182.67 | 3,247.54 | 3,370.27 | 3,435.14 | 3,557.87 | 3,622.74 | 3,745.47 |
| Camarilla | 3,441.42 | 3,458.62 | 3,475.81 | 3,493.01 | 3,510.21 | 3,527.40 | 3,544.60 |
| Woodie | 3,211.61 | 3,262.01 | 3,399.21 | 3,449.61 | 3,586.81 | 3,637.21 | 3,774.41 |
| Fibonacci | 3,247.54 | 3,319.20 | 3,363.47 | 3,435.14 | 3,506.80 | 3,551.07 | 3,622.74 |
Numerical data
The following is the status of the technical indicators and moving averages at the time of publication of this technical analysis:
| RSI (14): | 77.34 | |
| MACD (12,26,9): | 51.3000 | |
| Directional Movement: | 35.91 | |
| AROON (14): | 100.00 | |
| DEMA (21): | 3,796.19 | |
| Parabolic SAR (0,02-0,02-0,2): | 3,753.53 | |
| Elder Ray (13): | 66.76 | |
| Super Trend (3,10): | 3,744.22 | |
| Zig ZAG (10): | 3,826.99 | |
| VORTEX (21): | 1.2800 | |
| Stochastique (14,3,5): | 90.26 | |
| TEMA (21): | 3,824.91 | |
| Williams %R (14): | -6.29 | |
| Chande Momentum Oscillator (20): | 144.97 | |
| Repulse (5,40,3): | 0.9200 | |
| ROCnROLL: | 1 | |
| TRIX (15,9): | 0.1500 | |
| Courbe Coppock: | 7.63 |
| MA7: | 3,658.74 | |
| MA20: | 3,598.89 | |
| MA50: | 3,467.01 | |
| MA100: | 3,334.12 | |
| MAexp7: | 3,796.88 | |
| MAexp20: | 3,734.51 | |
| MAexp50: | 3,672.03 | |
| MAexp100: | 3,622.96 | |
| Price / MA7: | +4.63% | |
| Price / MA20: | +6.37% | |
| Price / MA50: | +10.42% | |
| Price / MA100: | +14.82% | |
| Price / MAexp7: | +0.79% | |
| Price / MAexp20: | +2.48% | |
| Price / MAexp50: | +4.22% | |
| Price / MAexp100: | +5.63% |
News
The latest news and videos published on AUTOZONE INC. at the time of the analysis were as follows:
-
 AutoZone earnings report: December 10
- Thinking about trading options or stock in Alphabet Inc, Autozone, Zoom Video Communications, TransMedics Group, or Viking Therapeutics?
- WEX Customers Can Now Save on AutoZone Parts
- Lectron Unveils New Retail Partnership with AutoZone, America's Leading Auto Parts Retailer
- Thinking about trading options or stock in DoorDash, Fiverr, AutoZone, Amazon, or Tesla?
About author
Online


Add a comment
Comments
0 comments on the analysis AUTOZONE INC. - 1H