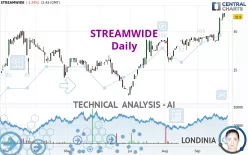
STREAMWIDE - Daily - Technical analysis published on 09/26/2024 (GMT)
- 126
- 0
Click here for a new analysis!
- Timeframe : Daily
- - Analysis generated on
- Status : INVALID

Summary of the analysis

Additional analysis
Quotes
STREAMWIDE rating 31.9 EUR. On the day, this instrument lost -1.24% with the lowest point at 31.9 EUR and the highest point at 32.4 EUR. The deviation from the price is 0% for the low point and -1.54% for the high point.A bullish gap was detected at the opening by the Central Gaps scanner. There are a lot of buyers and they have the upper hand in the very short term.
Opening Gap UP
Type : Bullish
Timeframe : Openning
A study of price movements over other periods shows the following variations:
New HIGH record (1 year)
Type : Bullish
Timeframe : Weekly
New HIGH record (1st january)
Type : Bullish
Timeframe : Weekly
New HIGH record (1 month)
Type : Bullish
Timeframe : Weekly
The Central Volumes scanner notes the presence of abnormal volumes:
Abnormal volumes
Timeframe : 5 days
Technical
Technical analysis of this Daily chart of STREAMWIDE indicates that the overall trend is strongly bullish. The signals given by the moving averages are 92.86% bullish. This strong bullish trend is confirmed by the strong signals currently being given by short-term moving averages. The Central Indicators scanner does not detect any result on moving averages that would impact this trend.
In fact, 15 technical indicators on 18 studied are currently positioned bullish. Caution: the Central Indicators scanner currently detects an excess:
CCI indicator is overbought : over 100
Type : Neutral
Timeframe : Daily
Previous candle closed over Bollinger bands
Type : Neutral
Timeframe : Daily
RSI indicator: bearish divergence
Type : Bearish
Timeframe : Daily
Williams %R indicator is overbought : over -20
Type : Neutral
Timeframe : Daily
Pivot points : price is over resistance 3
Type : Neutral
Timeframe : Weekly
Price is back under the pivot point
Type : Bearish
Timeframe : Daily
No signals are given by Central Patterns, a market scanner specialised in chart patterns, resistances and supports.
The presence of a bearish pattern in Japanese candlesticks detected by Central Candlesticks that could cause a correction in the very short term was also detected:
Dark cloud cover
Type : Bearish
Timeframe : Daily
| S3 | S2 | S1 | Price | R1 | R2 | R3 | |
|---|---|---|---|---|---|---|---|
| ProTrendLines | 26.3 | 28.9 | 30.0 | 31.9 | 35.3 | 37.7 | 40.6 |
| Change (%) | -17.55% | -9.40% | -5.96% | - | +10.66% | +18.18% | +27.27% |
| Change | -5.6 | -3.0 | -1.9 | - | +3.4 | +5.8 | +8.7 |
| Level | Intermediate | Intermediate | Intermediate | - | Minor | Minor | Major |
Attention could also be paid to pivot points to set price objectives:
| Pivot points | S3 | S2 | S1 | PP | R1 | R2 | R3 |
|---|---|---|---|---|---|---|---|
| Standard | 30.8 | 31.1 | 31.7 | 32.0 | 32.6 | 32.9 | 33.5 |
| Camarilla | 32.1 | 32.1 | 32.2 | 32.3 | 32.4 | 32.5 | 32.6 |
| Woodie | 31.0 | 31.2 | 31.9 | 32.1 | 32.8 | 33.0 | 33.7 |
| Fibonacci | 31.1 | 31.4 | 31.7 | 32.0 | 32.3 | 32.6 | 32.9 |
| Pivot points | S3 | S2 | S1 | PP | R1 | R2 | R3 |
|---|---|---|---|---|---|---|---|
| Standard | 27.7 | 28.2 | 29.0 | 29.5 | 30.3 | 30.8 | 31.6 |
| Camarilla | 29.4 | 29.6 | 29.7 | 29.8 | 29.9 | 30.0 | 30.2 |
| Woodie | 27.9 | 28.3 | 29.2 | 29.6 | 30.5 | 30.9 | 31.8 |
| Fibonacci | 28.2 | 28.7 | 29.0 | 29.5 | 30.0 | 30.3 | 30.8 |
| Pivot points | S3 | S2 | S1 | PP | R1 | R2 | R3 |
|---|---|---|---|---|---|---|---|
| Standard | 23.6 | 24.8 | 26.8 | 28.0 | 30.0 | 31.2 | 33.2 |
| Camarilla | 27.9 | 28.2 | 28.5 | 28.8 | 29.1 | 29.4 | 29.7 |
| Woodie | 24.0 | 25.0 | 27.2 | 28.2 | 30.4 | 31.4 | 33.6 |
| Fibonacci | 24.8 | 26.0 | 26.8 | 28.0 | 29.2 | 30.0 | 31.2 |
Numerical data
The following are the details of the technical indicators and moving averages that were collected to generate this technical analysis:
| RSI (14): | 68.30 | |
| MACD (12,26,9): | 0.8000 | |
| Directional Movement: | 32.9 | |
| AROON (14): | 78.6 | |
| DEMA (21): | 30.9 | |
| Parabolic SAR (0,02-0,02-0,2): | 29.8 | |
| Elder Ray (13): | 1.8 | |
| Super Trend (3,10): | 30.2 | |
| Zig ZAG (10): | 31.9 | |
| VORTEX (21): | 1.2000 | |
| Stochastique (14,3,5): | 92.40 | |
| TEMA (21): | 31.3 | |
| Williams %R (14): | -13.50 | |
| Chande Momentum Oscillator (20): | 2.5 | |
| Repulse (5,40,3): | 3.1000 | |
| ROCnROLL: | 1 | |
| TRIX (15,9): | 0.3000 | |
| Courbe Coppock: | 12.20 |
| MA7: | 30.7 | |
| MA20: | 29.7 | |
| MA50: | 28.8 | |
| MA100: | 27.0 | |
| MAexp7: | 31.1 | |
| MAexp20: | 29.9 | |
| MAexp50: | 28.8 | |
| MAexp100: | 27.5 | |
| Price / MA7: | +3.91% | |
| Price / MA20: | +7.41% | |
| Price / MA50: | +10.76% | |
| Price / MA100: | +18.15% | |
| Price / MAexp7: | +2.57% | |
| Price / MAexp20: | +6.69% | |
| Price / MAexp50: | +10.76% | |
| Price / MAexp100: | +16.00% |
News
Don't forget to follow the news on STREAMWIDE. At the time of publication of this analysis, the latest news was as follows:
- GROWTH IN 2024 HALF-YEAR RESULTS
- H1 REVENUE 2024: EUR 9.3M (+10%) CONTINUED SOLID GROWTH DRIVEN BY THE PLATFORMS BUSINESS (+24%) AND DIVERSIFICATION OF REVENUE SOURCES
- SOLID 2023 PERFORMANCE: INCREASE IN REVENUE, MARGINS AND EARNINGS
- 2023 REVENUE: EUR 19.5M (+11%) SOLID GROWTH DRIVEN BY PLATFORM BUSINESS (+16%)
- POSITIVE H1 2023 RESULTS OPERATING MARGINS UP
About author

Online


Add a comment
Comments
0 comments on the analysis STREAMWIDE - Daily