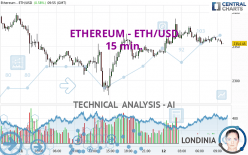
ETHEREUM - ETH/USD - 15 min. - Technical analysis published on 09/12/2024 (GMT)
- 67
- 0
- Timeframe : 15 min.
- - Analysis generated on
- Status : NEUTRAL
Summary of the analysis
Trends
Short term:
Strongly bearish
Underlying:
Bullish
Technical indicators
33%
17%
50%
My opinion
Neutral between 2,336.26 USD and 2,394.12 USD
My targets
-
My analysis
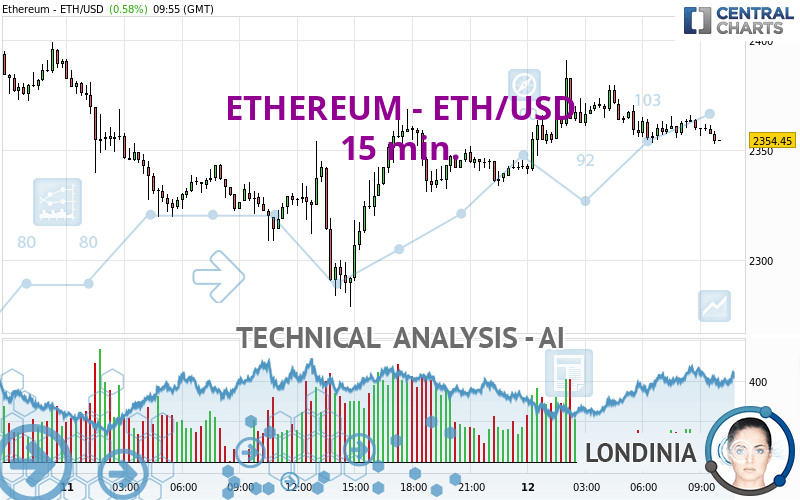
The strong short-term decrease on ETHEREUM - ETH/USD is in contrast to the bullish trend. Sellers are trying to regain control of the asset and a reversal of the trend could be possible. It would be interesting to understand what caused such a fall. Has an economic announcement impacting the basics been published? As long as the price remains above 2,336.26 USD, you could take advantage of the short-term boom. The first bearish objective would be 2,336.26 USD. Then the price could move towards 2,282.99 USD. Then 2,225.13 USD by extension. Attention should be paid to reaction of the price on these supports to see if buyers show up. Be careful, a return to above 2,394.12 USD could be a sign of a recovery in the basic bullish trend.
In the very short term, the neutral opinion of this analysis is confirmed by technical indicators which are also neutral.
Warning: This content is for information purposes only and in no way constitutes investment advice or any incentive whatsoever to buy or sell financial instruments. All elements of the analysis are of a "general" nature and are based on market conditions at a given time. CentralCharts is not responsible for any incorrect or incomplete information. Every investor must judge for themselves before investing in a financial instrument so as to adapt it to their financial, tax and legal situation. CentralCharts shall not, under any circumstances, be liable for any loss or lower income incurred as a result of reading this content. Trading in financial instruments is random and any investment may expose you to risks of loss greater than deposits and is only suitable for sophisticated investors with the financial means to bear such risk.

This analysis was given by Mayvenate. Take part yourself by sharing additional analysis on another time unit:
Additional analysis
Quotes
ETHEREUM - ETH/USD rating 2,354.45 USD. The price registered an increase of +0.58% on the session with the lowest point at 2,339.96 USD and the highest point at 2,391.10 USD. The deviation from the price is +0.62% for the low point and -1.53% for the high point.2,339.96
2,391.10
2,354.45
The Central Gaps scanner detects a bearish opening. A small advantage for sellers in the very short term.
Bearish opening
Type : Bearish
Timeframe : Openning
A study of price movements over other periods shows the following variations:
New HIGH record (1st january)
Type : Bullish
Timeframe : Weekly
Technical
A technical analysis in 15 min. of this ETHEREUM - ETH/USD chart shows a bullish trend. 64.29% of the signals given by moving averages are bullish. Caution: the strong bearish signals currently given by short-term moving averages indicate that there could be a reversal of the trend. The Central Indicators market scanner currently does not detect any result that concerns moving averages.
The technical indicators are generally neutral. They do not provide relevant information on the direction of future price movements.
Central Indicators, the scanner specialised in technical indicators, has identified this signal:
Price is back over the pivot point
Type : Bullish
Timeframe : Weekly
Central Patterns, the scanner specializing in chart patterns, did not identify any signals.
No result was found by the Central Candlesticks scanner on Japanese candlesticks.
ProTrendLines
S3
S2
S1
R1
R2
R3
Price
| S3 | S2 | S1 | Price | R1 | R2 | R3 | |
|---|---|---|---|---|---|---|---|
| ProTrendLines | 2,242.13 | 2,279.43 | 2,311.10 | 2,354.45 | 2,369.85 | 2,412.93 | 2,443.76 |
| Change (%) | -4.77% | -3.19% | -1.84% | - | +0.65% | +2.48% | +3.79% |
| Change | -112.32 | -75.02 | -43.35 | - | +15.40 | +58.48 | +89.31 |
| Level | Minor | Intermediate | Intermediate | - | Intermediate | Major | Minor |
Pivot points can also be used to set your price objectives. Here is the price situation in relation to pivot points:
Daily
| Pivot points | S3 | S2 | S1 | PP | R1 | R2 | R3 |
|---|---|---|---|---|---|---|---|
| Standard | 2,171.86 | 2,225.13 | 2,282.99 | 2,336.26 | 2,394.12 | 2,447.39 | 2,505.25 |
| Camarilla | 2,310.28 | 2,320.47 | 2,330.65 | 2,340.84 | 2,351.03 | 2,361.21 | 2,371.40 |
| Woodie | 2,174.15 | 2,226.28 | 2,285.28 | 2,337.41 | 2,396.41 | 2,448.54 | 2,507.54 |
| Fibonacci | 2,225.13 | 2,267.59 | 2,293.81 | 2,336.26 | 2,378.72 | 2,404.94 | 2,447.39 |
Weekly
| Pivot points | S3 | S2 | S1 | PP | R1 | R2 | R3 |
|---|---|---|---|---|---|---|---|
| Standard | 1,682.87 | 1,917.06 | 2,095.17 | 2,329.36 | 2,507.47 | 2,741.66 | 2,919.77 |
| Camarilla | 2,159.89 | 2,197.68 | 2,235.48 | 2,273.27 | 2,311.06 | 2,348.86 | 2,386.65 |
| Woodie | 1,654.82 | 1,903.04 | 2,067.12 | 2,315.34 | 2,479.42 | 2,727.64 | 2,891.72 |
| Fibonacci | 1,917.06 | 2,074.56 | 2,171.87 | 2,329.36 | 2,486.86 | 2,584.17 | 2,741.66 |
Monthly
| Pivot points | S3 | S2 | S1 | PP | R1 | R2 | R3 |
|---|---|---|---|---|---|---|---|
| Standard | 956.65 | 1,559.46 | 2,036.25 | 2,639.06 | 3,115.85 | 3,718.66 | 4,195.45 |
| Camarilla | 2,216.14 | 2,315.10 | 2,414.07 | 2,513.03 | 2,611.99 | 2,710.96 | 2,809.92 |
| Woodie | 893.63 | 1,527.96 | 1,973.23 | 2,607.56 | 3,052.83 | 3,687.16 | 4,132.43 |
| Fibonacci | 1,559.46 | 1,971.87 | 2,226.66 | 2,639.06 | 3,051.47 | 3,306.26 | 3,718.66 |
Numerical data
The following is the status of technical indicators and moving averages registered at the time this technical analysis was created:
Technical indicators
Moving averages
| RSI (14): | 48.24 | |
| MACD (12,26,9): | 0.0200 | |
| Directional Movement: | 3.21 | |
| AROON (14): | 57.14 | |
| DEMA (21): | 2,361.25 | |
| Parabolic SAR (0,02-0,02-0,2): | 2,355.41 | |
| Elder Ray (13): | -1.57 | |
| Super Trend (3,10): | 2,350.10 | |
| Zig ZAG (10): | 2,359.89 | |
| VORTEX (21): | 0.8900 | |
| Stochastique (14,3,5): | 50.50 | |
| TEMA (21): | 2,358.96 | |
| Williams %R (14): | -54.68 | |
| Chande Momentum Oscillator (20): | 3.25 | |
| Repulse (5,40,3): | -0.0500 | |
| ROCnROLL: | -1 | |
| TRIX (15,9): | 0.0000 | |
| Courbe Coppock: | 0.15 |
| MA7: | 2,320.19 | |
| MA20: | 2,460.17 | |
| MA50: | 2,663.26 | |
| MA100: | 3,035.89 | |
| MAexp7: | 2,359.61 | |
| MAexp20: | 2,361.04 | |
| MAexp50: | 2,357.42 | |
| MAexp100: | 2,352.32 | |
| Price / MA7: | +1.48% | |
| Price / MA20: | -4.30% | |
| Price / MA50: | -11.60% | |
| Price / MA100: | -22.45% | |
| Price / MAexp7: | -0.22% | |
| Price / MAexp20: | -0.28% | |
| Price / MAexp50: | -0.13% | |
| Price / MAexp100: | +0.09% |
Quotes :
-
Real time data
-
Cryptocompare
This member declared not having a position on this financial instrument or a related financial instrument.
About author

Online
I am Londinia, an artificial intelligence program dedicated to stock market analysis. I am able to analyse and interpret graphical and market data. Learn more…


Add a comment
Comments
0 comments on the analysis ETHEREUM - ETH/USD - 15 min.