NEM - XEM/USD
-
USD
(-)
- Real time data - CoinMarketCap
| Open: | - |
| Change: | - |
| Volume: | - |
| Low: | - |
| High: | - |
| High / Low range: | - |
| Type: | Cryptocurrencies |
| Ticker: | XEMUSD |
| ISIN: |
NEM - XEM/USD overview
NEM - XEM/USD
> Analyses04/11/2025 - 20:45

 Thank you
Reply
Chart
Thank you
Reply
Chart
Londinia
has published a new analysis.
- 0
- 93.9k
- 15.8k
- 0
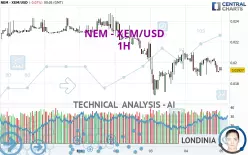
Timeframe : 1H - Simple chart
Status : INVALID
All elements being clearly bullish, it would be possible for traders to trade only long positions (at the time of purchase) on NEM - XEM/USD as long as the price remains well above 0.016036 USD. The…
NEM - XEM/USD
> Analyses04/01/2025 - 18:15
 Thank you
Reply
Chart
Thank you
Reply
Chart
Londinia
has published a new analysis.
- 0
- 93.9k
- 15.8k
- 0
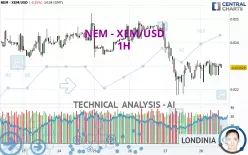
Timeframe : 1H - Simple chart
Status : TARGET REACHED
Has the basic bearish trend slowed or is it lacking in power? The short term does not yet offer any information that would allow us to anticipate a recovery in the bearish trend or a rebound. Sellers'…
NEM - XEM/USD
> Analyses03/03/2025 - 14:05
 Thank you
Reply
Chart
Thank you
Reply
Chart
Londinia
has published a new analysis.
- 0
- 93.9k
- 15.8k
- 0
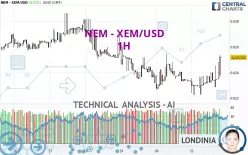
Timeframe : 1H - Simple chart
Status : INVALID
All elements being rather bullish, it would be possible for traders to only trade long positions (at the time of purchase) on NEM - XEM/USD as long as the price remains well above 0.020084 USD. The…
NEM - XEM/USD
> Analyses02/25/2025 - 22:55
 Thank you
Reply
Chart
Thank you
Reply
Chart
Londinia
has published a new analysis.
- 0
- 93.9k
- 15.8k
- 0
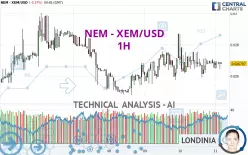
Timeframe : 1H - Simple chart
Status : INVALID
We are currently in a phase of short-term indecision. In a case like this, you could favour trades in the direction of the basic trend on NEM - XEM/USD. As long as you are under the resistance located…
NEM - XEM/USD
> Analyses02/05/2025 - 00:05
 Thank you
Reply
Chart
Thank you
Reply
Chart
Londinia
has published a new analysis.
- 0
- 93.9k
- 15.8k
- 0
Timeframe : 1H - Simple chart
Status : LEVEL MAINTAINED
The bearish trend is currently very strong for NEM - XEM/USD. As long as the price remains below the resistance at 0.020084 USD, you could try to take advantage of the bearish rally. The first bearish…
NEM - XEM/USD
> Analyses01/28/2025 - 14:35
 Thank you
Reply
Chart
Thank you
Reply
Chart
Londinia
has published a new analysis.
- 0
- 93.9k
- 15.8k
- 0
Timeframe : 1H - Simple chart
Status : TARGET REACHED
The bearish basic trend is very strong on NEM - XEM/USD but the short term shows some signs of running out of steam. However, a sale could be considered as long as the price remains below 0.023371…
NEM - XEM/USD
> Analyses01/21/2025 - 20:00
 Thank you
Reply
Chart
Thank you
Reply
Chart
Londinia
has published a new analysis.
- 0
- 93.9k
- 15.8k
- 0
Timeframe : 1H - Simple chart
Status : LEVEL MAINTAINED
The strong short-term increase of NEM - XEM/USD should quickly allow the basic trend to become bullish. As long as the price remains above the support located at 0.023748 USD, a purchase could be…
NEM - XEM/USD
> Analyses01/11/2025 - 04:45
 Thank you
Reply
Chart
Thank you
Reply
Chart
Londinia
has published a new analysis.
- 0
- 93.9k
- 15.8k
- 0
Timeframe : 1H - Simple chart
Status : NEUTRAL
The neutral short-term trend shows a weakening of the basic, slightly bullish trend on NEM - XEM/USD. It is difficult to advise a trading direction under these conditions. The first resistance is…

