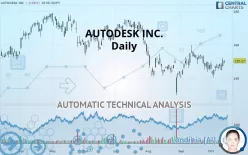
AUTODESK INC. - Daily - Technical analysis published on 10/14/2019 (GMT)
- 413
- 0
- Who voted?
- Timeframe : Daily
- - Analysis generated on
- Status : NEUTRAL

Summary of the analysis

Additional analysis
Quotes
The AUTODESK INC. rating is 150.27 USD. The price registered a decrease of -0.03% on the session and was traded between 148.58 USD and 150.43 USD over the period. The price is currently at +1.14% from its lowest and -0.11% from its highest.The Central Gaps scanner detects a bearish opening marking the presence of sellers ahead of buyers at the opening but not sufficiently marked to allow the price to register a quotation gap.
Bearish opening
Type : Bearish
Timeframe : Openning
Here is a more detailed summary of the historical variations registered by AUTODESK INC.:
Near a new HIGH record (1 month)
Type : Bullish
Timeframe : Weekly
Technical
Technical analysis of AUTODESK INC. in Daily shows an overall slightly bearish trend. 60.71% of the signals given by moving averages are bearish. Caution: the slightly bullish signals currently being given by short-term moving averages indicate that this overall trend could be reversed. The Central Indicators market scanner is currently detecting several bullish signals that could impact this trend:
Bullish price crossover with Moving Average 20
Type : Bullish
Timeframe : Daily
Bullish price crossover with Moving Average 50
Type : Bullish
Timeframe : Daily
Bullish price crossover with adaptative moving average 20
Type : Bullish
Timeframe : Daily
In fact, according to the parameters integrated into the Central Analyzer system, 10 technical indicators out of 18 analysed are currently bullish. Caution: the Central Indicators scanner currently detects an excess:
MACD indicator: bullish divergence
Type : Bullish
Timeframe : Daily
Williams %R indicator is overbought : over -20
Type : Neutral
Timeframe : Daily
RSI indicator is back over 50
Type : Bullish
Timeframe : Daily
MACD crosses UP its Moving Average
Type : Bullish
Timeframe : Daily
Parabolic SAR indicator bullish reversal
Type : Bullish
Timeframe : Daily
Price is back over the pivot point
Type : Bullish
Timeframe : Daily
Price is back over the pivot point
Type : Bullish
Timeframe : Weekly
Momentum indicator is back over 0
Type : Bullish
Timeframe : Daily
Williams %R indicator is back over -50
Type : Bullish
Timeframe : Daily
The Central Patterns scanner, which studies chart patterns, resistances and supports, has identified these signals:
Resistance of channel is broken
Type : Bullish
Timeframe : Daily
Horizontal support is broken
Type : Bearish
Timeframe : Daily
No result was found by the Central Candlesticks scanner on Japanese candlesticks.
| S3 | S2 | S1 | Price | R1 | R2 | R3 | |
|---|---|---|---|---|---|---|---|
| ProTrendLines | 64.59 | 118.32 | 139.67 | 150.27 | 150.33 | 157.20 | 164.50 |
| Change (%) | -57.02% | -21.26% | -7.05% | - | +0.04% | +4.61% | +9.47% |
| Change | -85.68 | -31.95 | -10.60 | - | +0.06 | +6.93 | +14.23 |
| Level | Intermediate | Major | Major | - | Intermediate | Major | Minor |
Pivot points can also be used to set your price objectives. Here is the price situation in relation to pivot points:
| Pivot points | S3 | S2 | S1 | PP | R1 | R2 | R3 |
|---|---|---|---|---|---|---|---|
| Standard | 141.70 | 144.20 | 147.26 | 149.76 | 152.82 | 155.32 | 158.38 |
| Camarilla | 148.79 | 149.30 | 149.81 | 150.32 | 150.83 | 151.34 | 151.85 |
| Woodie | 141.98 | 144.34 | 147.54 | 149.90 | 153.10 | 155.46 | 158.66 |
| Fibonacci | 144.20 | 146.32 | 147.64 | 149.76 | 151.88 | 153.20 | 155.32 |
| Pivot points | S3 | S2 | S1 | PP | R1 | R2 | R3 |
|---|---|---|---|---|---|---|---|
| Standard | 138.03 | 141.27 | 145.79 | 149.03 | 153.55 | 156.79 | 161.31 |
| Camarilla | 148.19 | 148.90 | 149.61 | 150.32 | 151.03 | 151.74 | 152.45 |
| Woodie | 138.68 | 141.59 | 146.44 | 149.35 | 154.20 | 157.11 | 161.96 |
| Fibonacci | 141.27 | 144.23 | 146.06 | 149.03 | 151.99 | 153.82 | 156.79 |
| Pivot points | S3 | S2 | S1 | PP | R1 | R2 | R3 |
|---|---|---|---|---|---|---|---|
| Standard | 118.41 | 129.14 | 138.42 | 149.15 | 158.43 | 169.16 | 178.44 |
| Camarilla | 142.20 | 144.03 | 145.87 | 147.70 | 149.53 | 151.37 | 153.20 |
| Woodie | 117.69 | 128.78 | 137.70 | 148.79 | 157.71 | 168.80 | 177.72 |
| Fibonacci | 129.14 | 136.78 | 141.51 | 149.15 | 156.79 | 161.52 | 169.16 |
Numerical data
The following is the status of the technical indicators and moving averages at the time of publication of this technical analysis:
| RSI (14): | 52.90 | |
| MACD (12,26,9): | -0.5700 | |
| Directional Movement: | -2.51 | |
| AROON (14): | -50.00 | |
| DEMA (21): | 147.21 | |
| Parabolic SAR (0,02-0,02-0,2): | 140.50 | |
| Elder Ray (13): | 1.63 | |
| Super Trend (3,10): | 142.00 | |
| Zig ZAG (10): | 150.27 | |
| VORTEX (21): | 0.8900 | |
| Stochastique (14,3,5): | 64.03 | |
| TEMA (21): | 147.82 | |
| Williams %R (14): | -16.58 | |
| Chande Momentum Oscillator (20): | 1.20 | |
| Repulse (5,40,3): | 1.3500 | |
| ROCnROLL: | -1 | |
| TRIX (15,9): | -0.0800 | |
| Courbe Coppock: | 4.39 |
| MA7: | 147.68 | |
| MA20: | 148.48 | |
| MA50: | 147.83 | |
| MA100: | 156.66 | |
| MAexp7: | 148.08 | |
| MAexp20: | 148.12 | |
| MAexp50: | 150.52 | |
| MAexp100: | 153.79 | |
| Price / MA7: | +1.75% | |
| Price / MA20: | +1.21% | |
| Price / MA50: | +1.65% | |
| Price / MA100: | -4.08% | |
| Price / MAexp7: | +1.48% | |
| Price / MAexp20: | +1.45% | |
| Price / MAexp50: | -0.17% | |
| Price / MAexp100: | -2.29% |
News
Don"t forget to follow the news on AUTODESK INC.. At the time of publication of this analysis, the latest news was as follows:
- Autodesk Unveils Robust New Features for BIM 360
- Autodesk Appoints Dr. Ayanna Howard to Board of Directors
- Autodesk to Present at Citi Global Technology Conference
- Autodesk, Inc. Announces Fiscal 2020 Second Quarter Results
- Autodesk Integrates BuildingConnected with PlanGrid to Streamline Workflows Between Preconstruction and Field Teams
About author

Online


Add a comment
Comments
0 comments on the analysis AUTODESK INC. - Daily