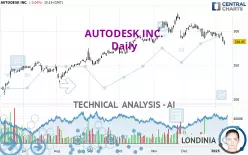
AUTODESK INC. - Daily - Technical analysis published on 01/13/2025 (GMT)
- 153
- 0
Click here for a new analysis!
- Timeframe : Daily
- - Analysis generated on
- Status : INVALID

Summary of the analysis

Additional analysis
Quotes
AUTODESK INC. rating 284.85 USD. The price registered a decrease of -0.04% on the session and was traded between 279.84 USD and 286.65 USD over the period. The price is currently at +1.79% from its lowest and -0.63% from its highest.The Central Gaps scanner detects the formation of a bearish gap marking the strong presence of sellers ahead of buyers at the opening. This formed a quotation gap.
Opening Gap DOWN
Type : Bearish
Timeframe : Openning
Here is a more detailed summary of the historical variations registered by AUTODESK INC.:
Near a new HIGH record (1st january)
Type : Bullish
Timeframe : Weekly
New LOW record (1st january)
Type : Bearish
Timeframe : Weekly
New LOW record (1 month)
Type : Bearish
Timeframe : Weekly
Technical
Technical analysis of this Daily chart of AUTODESK INC. indicates that the overall trend is slightly bearish. 60.71% of the signals given by moving averages are bearish. The overall trend could accelerate as a result of the strong bearish signals from short-term moving averages. The Central Indicators market scanner is currently detecting several bearish signals that could impact this trend:
Bearish trend reversal : Moving Average 50
Type : Bearish
Timeframe : Daily
Bearish trend reversal : adaptative moving average 100
Type : Bearish
Timeframe : Daily
Bearish price crossover with Moving Average 100
Type : Bearish
Timeframe : Daily
In fact, 14 technical indicators on 18 studied are currently positioned bearish. Caution: the Central Indicators scanner currently detects an excess:
CCI indicator is oversold : under -100
Type : Neutral
Timeframe : Daily
RSI indicator: bullish divergence
Type : Bullish
Timeframe : Daily
The Central Patterns scanner, which studies chart patterns, resistances and supports, has identified this signal:
Support of channel is broken
Type : Bearish
Timeframe : Daily
The Central Candlesticks scanner, specialised in Japanese candlesticks, did not identify any signals.
| S3 | S2 | S1 | Price | R1 | R2 | R3 | |
|---|---|---|---|---|---|---|---|
| ProTrendLines | 221.95 | 253.91 | 266.68 | 284.85 | 300.16 | 309.34 | 321.27 |
| Change (%) | -22.08% | -10.86% | -6.38% | - | +5.37% | +8.60% | +12.79% |
| Change | -62.90 | -30.94 | -18.17 | - | +15.31 | +24.49 | +36.42 |
| Level | Intermediate | Minor | Major | - | Major | Minor | Intermediate |
Pivot points can also be used to set your price objectives. Here is the price situation in relation to pivot points:
| Pivot points | S3 | S2 | S1 | PP | R1 | R2 | R3 |
|---|---|---|---|---|---|---|---|
| Standard | 273.94 | 279.21 | 282.08 | 287.35 | 290.22 | 295.49 | 298.36 |
| Camarilla | 282.72 | 283.47 | 284.21 | 284.96 | 285.71 | 286.45 | 287.20 |
| Woodie | 272.75 | 278.61 | 280.89 | 286.75 | 289.03 | 294.89 | 297.17 |
| Fibonacci | 279.21 | 282.32 | 284.24 | 287.35 | 290.46 | 292.38 | 295.49 |
| Pivot points | S3 | S2 | S1 | PP | R1 | R2 | R3 |
|---|---|---|---|---|---|---|---|
| Standard | 265.84 | 275.15 | 280.06 | 289.37 | 294.28 | 303.59 | 308.50 |
| Camarilla | 281.05 | 282.35 | 283.66 | 284.96 | 286.26 | 287.57 | 288.87 |
| Woodie | 263.63 | 274.05 | 277.85 | 288.27 | 292.07 | 302.49 | 306.29 |
| Fibonacci | 275.15 | 280.59 | 283.94 | 289.37 | 294.81 | 298.16 | 303.59 |
| Pivot points | S3 | S2 | S1 | PP | R1 | R2 | R3 |
|---|---|---|---|---|---|---|---|
| Standard | 262.60 | 275.57 | 285.57 | 298.54 | 308.54 | 321.51 | 331.51 |
| Camarilla | 289.25 | 291.36 | 293.46 | 295.57 | 297.68 | 299.78 | 301.89 |
| Woodie | 261.12 | 274.83 | 284.09 | 297.80 | 307.06 | 320.77 | 330.03 |
| Fibonacci | 275.57 | 284.35 | 289.77 | 298.54 | 307.32 | 312.74 | 321.51 |
Numerical data
The following is the status of technical indicators and moving averages registered at the time this technical analysis was created:
| RSI (14): | 36.83 | |
| MACD (12,26,9): | -2.8300 | |
| Directional Movement: | -16.70 | |
| AROON (14): | -100.00 | |
| DEMA (21): | 293.28 | |
| Parabolic SAR (0,02-0,02-0,2): | 298.69 | |
| Elder Ray (13): | -6.05 | |
| Super Trend (3,10): | 308.68 | |
| Zig ZAG (10): | 284.96 | |
| VORTEX (21): | 0.7700 | |
| Stochastique (14,3,5): | 22.65 | |
| TEMA (21): | 289.50 | |
| Williams %R (14): | -97.16 | |
| Chande Momentum Oscillator (20): | -13.16 | |
| Repulse (5,40,3): | -3.3800 | |
| ROCnROLL: | 2 | |
| TRIX (15,9): | -0.0900 | |
| Courbe Coppock: | 5.70 |
| MA7: | 292.52 | |
| MA20: | 297.73 | |
| MA50: | 300.71 | |
| MA100: | 284.76 | |
| MAexp7: | 292.25 | |
| MAexp20: | 296.34 | |
| MAexp50: | 295.42 | |
| MAexp100: | 285.53 | |
| Price / MA7: | -2.62% | |
| Price / MA20: | -4.33% | |
| Price / MA50: | -5.27% | |
| Price / MA100: | +0.03% | |
| Price / MAexp7: | -2.53% | |
| Price / MAexp20: | -3.88% | |
| Price / MAexp50: | -3.58% | |
| Price / MAexp100: | -0.24% |
News
Don't forget to follow the news on AUTODESK INC.. At the time of publication of this analysis, the latest news was as follows:
- Autodesk announces appointment of two new independent directors
- Autodesk to present at upcoming investor conferences
- AUTODESK, INC. ANNOUNCES FISCAL 2025 THIRD QUARTER RESULTS
- Autodesk appoints Janesh Moorjani as chief financial officer
- Autodesk extends invitation to join financial results conference call
About author
Online


Add a comment
Comments
0 comments on the analysis AUTODESK INC. - Daily