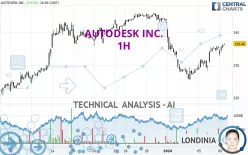
AUTODESK INC. - 1H - Technical analysis published on 01/09/2024 (GMT)
- 227
- 0
Click here for a new analysis!
- Timeframe : 1H
- - Analysis generated on
- Status : LEVEL MAINTAINED

Summary of the analysis

Additional analysis
Quotes
The AUTODESK INC. rating is 235.36 USD. The price registered a decrease of -0.04% on the session and was between 232.63 USD and 235.85 USD. This implies that the price is at +1.17% from its lowest and at -0.21% from its highest.The Central Gaps scanner detects a bearish opening marking the presence of sellers ahead of buyers at the opening but not sufficiently marked to allow the price to register a quotation gap.
Bearish opening
Type : Bearish
Timeframe : Openning
So that you have an overall view of the price change, here is a table showing the variations over several periods:
Near a new HIGH record (1 year)
Type : Bullish
Timeframe : Weekly
Near a new LOW record (1st january)
Type : Bearish
Timeframe : Weekly
Near a new HIGH record (1 month)
Type : Bullish
Timeframe : Weekly
Technical
A technical analysis in 1H of this AUTODESK INC. chart shows a neutral trend. The strong bullish signals currently being given by short-term moving averages could allow the overall trend to return to bullish. There is no crossing of moving average by the price or crossing of moving averages between themselves.
An assessment of technical indicators shows a moderate bullish signal.
Caution: the Central Indicators scanner currently detects an excess:
Williams %R indicator is overbought : over -20
Type : Neutral
Timeframe : 1 hour
Price is back over the pivot point
Type : Bullish
Timeframe : Weekly
The Central Patterns scanner, which studies chart patterns, resistances and supports, has identified these signals:
Near horizontal resistance
Type : Bearish
Timeframe : 1 hour
Near resistance of channel
Type : Bearish
Timeframe : 1 hour
Central Candlesticks, the scanner specialised in Japanese candlesticks, detects a bearish signal that could support the hypothesis of a small drop in the very short term:
Bearish harami
Type : Bearish
Timeframe : 1 hour
| S3 | S2 | S1 | Price | R1 | R2 | R3 | |
|---|---|---|---|---|---|---|---|
| ProTrendLines | 222.20 | 225.35 | 234.04 | 235.36 | 245.11 | 261.07 | 320.13 |
| Change (%) | -5.59% | -4.25% | -0.56% | - | +4.14% | +10.92% | +36.02% |
| Change | -13.16 | -10.01 | -1.32 | - | +9.75 | +25.71 | +84.77 |
| Level | Minor | Major | Major | - | Major | Minor | Intermediate |
To determine price objectives, it is also possible to use the pivot points. Here is the price position in relation to pivot points:
| Pivot points | S3 | S2 | S1 | PP | R1 | R2 | R3 |
|---|---|---|---|---|---|---|---|
| Standard | 227.00 | 228.89 | 232.17 | 234.06 | 237.34 | 239.23 | 242.51 |
| Camarilla | 234.03 | 234.50 | 234.98 | 235.45 | 235.92 | 236.40 | 236.87 |
| Woodie | 227.70 | 229.24 | 232.87 | 234.41 | 238.04 | 239.58 | 243.21 |
| Fibonacci | 228.89 | 230.87 | 232.09 | 234.06 | 236.04 | 237.26 | 239.23 |
| Pivot points | S3 | S2 | S1 | PP | R1 | R2 | R3 |
|---|---|---|---|---|---|---|---|
| Standard | 207.16 | 216.31 | 222.91 | 232.06 | 238.66 | 247.81 | 254.41 |
| Camarilla | 225.19 | 226.63 | 228.08 | 229.52 | 230.96 | 232.41 | 233.85 |
| Woodie | 205.90 | 215.67 | 221.65 | 231.42 | 237.40 | 247.17 | 253.15 |
| Fibonacci | 216.31 | 222.32 | 226.04 | 232.06 | 238.07 | 241.79 | 247.81 |
| Pivot points | S3 | S2 | S1 | PP | R1 | R2 | R3 |
|---|---|---|---|---|---|---|---|
| Standard | 195.80 | 206.29 | 224.89 | 235.38 | 253.98 | 264.47 | 283.07 |
| Camarilla | 235.48 | 238.15 | 240.81 | 243.48 | 246.15 | 248.81 | 251.48 |
| Woodie | 199.85 | 208.32 | 228.94 | 237.41 | 258.03 | 266.50 | 287.12 |
| Fibonacci | 206.29 | 217.41 | 224.27 | 235.38 | 246.50 | 253.36 | 264.47 |
Numerical data
The following are the details of the technical indicators and moving averages that were collected to generate this technical analysis:
| RSI (14): | 59.35 | |
| MACD (12,26,9): | 0.7600 | |
| Directional Movement: | 5.92 | |
| AROON (14): | 50.00 | |
| DEMA (21): | 233.89 | |
| Parabolic SAR (0,02-0,02-0,2): | 235.88 | |
| Elder Ray (13): | 1.58 | |
| Super Trend (3,10): | 230.81 | |
| Zig ZAG (10): | 235.29 | |
| VORTEX (21): | 1.1900 | |
| Stochastique (14,3,5): | 88.14 | |
| TEMA (21): | 235.99 | |
| Williams %R (14): | -7.08 | |
| Chande Momentum Oscillator (20): | 4.10 | |
| Repulse (5,40,3): | 0.7400 | |
| ROCnROLL: | 1 | |
| TRIX (15,9): | 0.0100 | |
| Courbe Coppock: | 4.76 |
| MA7: | 233.44 | |
| MA20: | 237.00 | |
| MA50: | 221.15 | |
| MA100: | 215.45 | |
| MAexp7: | 234.87 | |
| MAexp20: | 233.41 | |
| MAexp50: | 234.37 | |
| MAexp100: | 234.67 | |
| Price / MA7: | +0.82% | |
| Price / MA20: | -0.69% | |
| Price / MA50: | +6.43% | |
| Price / MA100: | +9.24% | |
| Price / MAexp7: | +0.21% | |
| Price / MAexp20: | +0.84% | |
| Price / MAexp50: | +0.42% | |
| Price / MAexp100: | +0.29% |
News
The latest news and videos published on AUTODESK INC. at the time of the analysis were as follows:
- Autodesk appoints Joe Speicher as its first chief sustainability officer
- Autodesk to present at upcoming investor conferences
- AUTODESK, INC. ANNOUNCES FISCAL 2024 THIRD QUARTER RESULTS
- Introducing Autodesk AI for Design and Make
- AI and the Design and Make Platform take the main stage at Autodesk University
About author
Online


Add a comment
Comments
0 comments on the analysis AUTODESK INC. - 1H