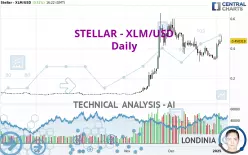
STELLAR - XLM/USD - Daily - Technical analysis published on 01/04/2025 (GMT)
- 105
- 0
Click here for a new analysis!
- Timeframe : Daily
- - Analysis generated on
- Status : INVALID

Summary of the analysis

Additional analysis
Quotes
The STELLAR - XLM/USD rating is 0.450318 USD. On the day, this instrument gained +0.51% with the lowest point at 0.444127 USD and the highest point at 0.485590 USD. The deviation from the price is +1.39% for the low point and -7.26% for the high point.A bearish opening was detected by the Central Gaps scanner. Sellers are trying to impose a bearish trend in the very short term.
Bearish opening
Type : Bearish
Timeframe : Openning
A study of price movements over other periods shows the following variations:
New HIGH record (1st january)
Type : Bullish
Timeframe : Weekly
Technical
A technical analysis in Daily of this STELLAR - XLM/USD chart shows a strongly bullish trend. 89.29% of the signals given by moving averages are bullish. The overall trend is supported by the strong bullish signals from short-term moving averages. The Central Indicators scanner detects a bullish signal on moving averages that could impact this trend:
Bullish trend reversal : Moving Average 20
Type : Bullish
Timeframe : Daily
In fact, 14 technical indicators on 18 studied are currently positioned bullish. Caution: the Central Indicators scanner currently detects an excess:
CCI indicator is overbought : over 100
Type : Neutral
Timeframe : Daily
Pivot points : price is over resistance 2
Type : Neutral
Timeframe : Weekly
Ichimoku : price is over the cloud
Type : Bullish
Timeframe : Daily
Ichimoku - Bullish crossover : Tenkan & Kijun
Type : Bullish
Timeframe : Daily
An analysis of the price chart with the Central Patterns scanner (detector of chart patterns and resistances and supports) shows a result that can have an impact on the price change:
Horizontal resistance is broken
Type : Bullish
Timeframe : Daily
From the Japanese candlestick perspective, the Central Candlesticks scanner notes the presence of these results that could impact the short-term trend:
Doji
Type : Neutral
Timeframe : Daily
Three white soldiers
Type : Bullish
Timeframe : Daily
| S3 | S2 | S1 | Price | R1 | R2 | |
|---|---|---|---|---|---|---|
| ProTrendLines | 0.355811 | 0.402200 | 0.438409 | 0.450318 | 0.504402 | 0.559483 |
| Change (%) | -20.99% | -10.69% | -2.64% | - | +12.01% | +24.24% |
| Change | -0.094507 | -0.048118 | -0.011909 | - | +0.054084 | +0.109165 |
| Level | Minor | Intermediate | Intermediate | - | Minor | Major |
To determine price objectives, it is also possible to use the pivot points. Here is the price position in relation to pivot points:
| Pivot points | S3 | S2 | S1 | PP | R1 | R2 | R3 |
|---|---|---|---|---|---|---|---|
| Standard | 0.401548 | 0.415608 | 0.431826 | 0.445886 | 0.462104 | 0.476164 | 0.492382 |
| Camarilla | 0.439718 | 0.442493 | 0.445269 | 0.448044 | 0.450820 | 0.453595 | 0.456371 |
| Woodie | 0.402627 | 0.416148 | 0.432905 | 0.446426 | 0.463183 | 0.476704 | 0.493461 |
| Fibonacci | 0.415608 | 0.427174 | 0.434320 | 0.445886 | 0.457452 | 0.464598 | 0.476164 |
| Pivot points | S3 | S2 | S1 | PP | R1 | R2 | R3 |
|---|---|---|---|---|---|---|---|
| Standard | 0.256882 | 0.299870 | 0.327720 | 0.370708 | 0.398558 | 0.441546 | 0.469396 |
| Camarilla | 0.336090 | 0.342583 | 0.349077 | 0.355570 | 0.362064 | 0.368557 | 0.375051 |
| Woodie | 0.249313 | 0.296086 | 0.320151 | 0.366924 | 0.390989 | 0.437762 | 0.461827 |
| Fibonacci | 0.299870 | 0.326930 | 0.343648 | 0.370708 | 0.397768 | 0.414486 | 0.441546 |
| Pivot points | S3 | S2 | S1 | PP | R1 | R2 | R3 |
|---|---|---|---|---|---|---|---|
| Standard | -0.058370 | 0.126963 | 0.229470 | 0.414803 | 0.517310 | 0.702643 | 0.805150 |
| Camarilla | 0.252821 | 0.279206 | 0.305592 | 0.331977 | 0.358362 | 0.384748 | 0.411133 |
| Woodie | -0.099783 | 0.106257 | 0.188057 | 0.394097 | 0.475897 | 0.681937 | 0.763737 |
| Fibonacci | 0.126963 | 0.236918 | 0.304848 | 0.414803 | 0.524758 | 0.592688 | 0.702643 |
Numerical data
The following are the details of the technical indicators and moving averages that were collected to generate this technical analysis:
| RSI (14): | 60.81 | |
| MACD (12,26,9): | 0.0051 | |
| Directional Movement: | 13.763641 | |
| AROON (14): | 35.714286 | |
| DEMA (21): | 0.400224 | |
| Parabolic SAR (0,02-0,02-0,2): | 0.328923 | |
| Elder Ray (13): | 0.066772 | |
| Super Trend (3,10): | 0.337983 | |
| Zig ZAG (10): | 0.448698 | |
| VORTEX (21): | 1.0386 | |
| Stochastique (14,3,5): | 83.58 | |
| TEMA (21): | 0.391032 | |
| Williams %R (14): | -22.10 | |
| Chande Momentum Oscillator (20): | 0.078470 | |
| Repulse (5,40,3): | 4.4429 | |
| ROCnROLL: | 1 | |
| TRIX (15,9): | -0.3007 | |
| Courbe Coppock: | 9.41 |
| MA7: | 0.393272 | |
| MA20: | 0.383308 | |
| MA50: | 0.409849 | |
| MA100: | 0.254087 | |
| MAexp7: | 0.411260 | |
| MAexp20: | 0.395765 | |
| MAexp50: | 0.364946 | |
| MAexp100: | 0.295142 | |
| Price / MA7: | +14.51% | |
| Price / MA20: | +17.48% | |
| Price / MA50: | +9.87% | |
| Price / MA100: | +77.23% | |
| Price / MAexp7: | +9.50% | |
| Price / MAexp20: | +13.78% | |
| Price / MAexp50: | +23.39% | |
| Price / MAexp100: | +52.58% |
About author

Online


Add a comment
Comments
0 comments on the analysis STELLAR - XLM/USD - Daily