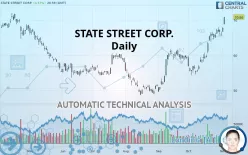
STATE STREET CORP. - Daily - Technical analysis published on 11/05/2019 (GMT)
- 179
- 0
- Who voted?
Click here for a new analysis!
- Timeframe : Daily
- - Analysis generated on
- Status : TARGET REACHED

Summary of the analysis

Additional analysis
Quotes
STATE STREET CORP. rating 70.86 USD. The price has increased by +4.58% since the last closing and was between 68.79 USD and 70.91 USD. This implies that the price is at +3.01% from its lowest and at -0.07% from its highest.A bullish gap was detected at the opening by the Central Gaps scanner. There are a lot of buyers and they have the upper hand in the very short term.
Opening Gap UP
Type : Bullish
Timeframe : Openning
A study of price movements over other periods shows the following variations:
Technical
Technical analysis of STATE STREET CORP. in Daily shows a strongly overall bullish trend. 92.86% of the signals given by moving averages are bullish. This strongly bullish trend is supported by the strong bullish signals given by short-term moving averages. The Central Indicators market scanner currently does not detect any result that concerns moving averages.
In fact, 15 technical indicators on 18 studied are currently bullish. Caution: the Central Indicators scanner currently detects an excess:
Williams %R indicator is overbought : over -20
Type : Neutral
Timeframe : Daily
Pivot points : price is over resistance 1
Type : Neutral
Timeframe : Weekly
Pivot points : price is over resistance 2
Type : Neutral
Timeframe : Daily
The Central Patterns scanner, which studies chart patterns, resistances and supports, has identified this signal:
Horizontal resistance is broken
Type : Bullish
Timeframe : Daily
Central Candlesticks, the scanner specialised in Japanese candlesticks, detects this inversion signal that could impact the current short-term trend:
Doji
Type : Neutral
Timeframe : Daily
| S3 | S2 | S1 | Price | R1 | R2 | R3 | |
|---|---|---|---|---|---|---|---|
| ProTrendLines | 55.19 | 61.14 | 65.59 | 70.86 | 72.78 | 85.37 | 99.15 |
| Change (%) | -22.11% | -13.72% | -7.44% | - | +2.71% | +20.48% | +39.92% |
| Change | -15.67 | -9.72 | -5.27 | - | +1.92 | +14.51 | +28.29 |
| Level | Major | Intermediate | Major | - | Intermediate | Intermediate | Intermediate |
Attention could also be paid to pivot points to set price objectives:
| Pivot points | S3 | S2 | S1 | PP | R1 | R2 | R3 |
|---|---|---|---|---|---|---|---|
| Standard | 64.00 | 64.68 | 65.37 | 66.05 | 66.74 | 67.42 | 68.11 |
| Camarilla | 65.69 | 65.82 | 65.94 | 66.07 | 66.20 | 66.32 | 66.45 |
| Woodie | 64.02 | 64.68 | 65.39 | 66.05 | 66.76 | 67.42 | 68.13 |
| Fibonacci | 64.68 | 65.20 | 65.52 | 66.05 | 66.57 | 66.89 | 67.42 |
| Pivot points | S3 | S2 | S1 | PP | R1 | R2 | R3 |
|---|---|---|---|---|---|---|---|
| Standard | 61.13 | 62.44 | 64.10 | 65.41 | 67.07 | 68.38 | 70.04 |
| Camarilla | 64.93 | 65.21 | 65.48 | 65.75 | 66.02 | 66.30 | 66.57 |
| Woodie | 61.30 | 62.53 | 64.27 | 65.50 | 67.24 | 68.47 | 70.21 |
| Fibonacci | 62.44 | 63.58 | 64.28 | 65.41 | 66.55 | 67.25 | 68.38 |
| Pivot points | S3 | S2 | S1 | PP | R1 | R2 | R3 |
|---|---|---|---|---|---|---|---|
| Standard | 43.99 | 49.15 | 57.61 | 62.77 | 71.23 | 76.39 | 84.85 |
| Camarilla | 62.32 | 63.57 | 64.82 | 66.07 | 67.32 | 68.57 | 69.82 |
| Woodie | 45.64 | 49.98 | 59.26 | 63.60 | 72.88 | 77.22 | 86.50 |
| Fibonacci | 49.15 | 54.35 | 57.57 | 62.77 | 67.97 | 71.19 | 76.39 |
Numerical data
The following are the details of the technical indicators and moving averages that were collected to generate this technical analysis:
| RSI (14): | 72.39 | |
| MACD (12,26,9): | 2.6900 | |
| Directional Movement: | 22.80 | |
| AROON (14): | 100.00 | |
| DEMA (21): | 66.83 | |
| Parabolic SAR (0,02-0,02-0,2): | 64.83 | |
| Elder Ray (13): | 2.45 | |
| Super Trend (3,10): | 62.26 | |
| Zig ZAG (10): | 67.76 | |
| VORTEX (21): | 1.2300 | |
| Stochastique (14,3,5): | 89.21 | |
| TEMA (21): | 68.05 | |
| Williams %R (14): | -2.14 | |
| Chande Momentum Oscillator (20): | 8.65 | |
| Repulse (5,40,3): | 2.3600 | |
| ROCnROLL: | 1 | |
| TRIX (15,9): | 0.5700 | |
| Courbe Coppock: | 31.31 |
| MA7: | 66.55 | |
| MA20: | 62.29 | |
| MA50: | 58.37 | |
| MA100: | 56.42 | |
| MAexp7: | 66.36 | |
| MAexp20: | 63.45 | |
| MAexp50: | 60.00 | |
| MAexp100: | 58.84 | |
| Price / MA7: | +6.48% | |
| Price / MA20: | +13.76% | |
| Price / MA50: | +21.40% | |
| Price / MA100: | +25.59% | |
| Price / MAexp7: | +6.78% | |
| Price / MAexp20: | +11.68% | |
| Price / MAexp50: | +18.10% | |
| Price / MAexp100: | +20.43% |
News
The last news published on STATE STREET CORP. at the time of the generation of this analysis was as follows:
- Form 8.3 - [Alletgan Plc]
- Form 8.3 - Green REIT plc
- Form 8.3 - [Green REIT Plc]
- Form 8.3 - [Green REIT Plc]
- Form 8.3 - Green REIT plc
About author

Online


Add a comment
Comments
0 comments on the analysis STATE STREET CORP. - Daily