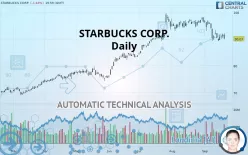
STARBUCKS CORP. - Daily - Technical analysis published on 09/22/2019 (GMT)
- 358
- 0
- Who voted?
Click here for a new analysis!
- Timeframe : Daily
- - Analysis generated on
- Status : TARGET REACHED

Summary of the analysis

Additional analysis
Quotes
STARBUCKS CORP. rating 90.07 USD. The price registered a decrease of -1.63% on the session and was traded between 90.06 USD and 92.08 USD over the period. The price is currently at +0.01% from its lowest and -2.18% from its highest.A bullish opening was detected by the Central Gaps scanner. Buyers are trying to impose a bullish momentum in the very short term.
Bullish opening
Type : Bullish
Timeframe : Openning
Here is a more detailed summary of the historical variations registered by STARBUCKS CORP.:
Near a new LOW record (1 month)
Type : Bearish
Timeframe : Weekly
Technical
Technical analysis of this Daily chart of STARBUCKS CORP. indicates that the overall trend is slightly bullish. 53.57% of the signals given by moving averages are bullish. Caution: the strong bearish signals currently given by short-term moving averages indicate that a trend reversal may be taking place. The Central Indicators market scanner currently does not detect any result that concerns moving averages.
In fact, only 9 technical indicators out of 18 studied are currently bearish. Central Indicators, the detector scanner for these technical indicators has recently detected several signals:
Pivot points : price is under support 1
Type : Neutral
Timeframe : Daily
Price is back over the pivot point
Type : Bullish
Timeframe : Daily
Price is back under the pivot point
Type : Bearish
Timeframe : Weekly
An analysis of the price chart with the Central Patterns scanner (detector of chart patterns and resistances and supports) shows several results that can have an impact on the price change:
Horizontal support is broken
Type : Bearish
Timeframe : Daily
Support of triangle is broken
Type : Bearish
Timeframe : Daily
No result was found by the Central Candlesticks scanner on Japanese candlesticks.
| S3 | S2 | S1 | Price | R1 | R2 | R3 | |
|---|---|---|---|---|---|---|---|
| ProTrendLines | 61.69 | 75.28 | 84.69 | 90.07 | 90.23 | 94.72 | 99.11 |
| Change (%) | -31.51% | -16.42% | -5.97% | - | +0.18% | +5.16% | +10.04% |
| Change | -28.38 | -14.79 | -5.38 | - | +0.16 | +4.65 | +9.04 |
| Level | Major | Intermediate | Minor | - | Intermediate | Major | Major |
To determine price objectives, it is also possible to use the pivot points. Here is the price position in relation to pivot points:
| Pivot points | S3 | S2 | S1 | PP | R1 | R2 | R3 |
|---|---|---|---|---|---|---|---|
| Standard | 88.74 | 89.52 | 90.54 | 91.32 | 92.34 | 93.12 | 94.14 |
| Camarilla | 91.07 | 91.23 | 91.40 | 91.56 | 91.73 | 91.89 | 92.06 |
| Woodie | 88.86 | 89.58 | 90.66 | 91.38 | 92.46 | 93.18 | 94.26 |
| Fibonacci | 89.52 | 90.21 | 90.63 | 91.32 | 92.01 | 92.43 | 93.12 |
| Pivot points | S3 | S2 | S1 | PP | R1 | R2 | R3 |
|---|---|---|---|---|---|---|---|
| Standard | 81.25 | 85.28 | 87.88 | 91.90 | 94.51 | 98.53 | 101.13 |
| Camarilla | 88.66 | 89.27 | 89.87 | 90.48 | 91.09 | 91.70 | 92.30 |
| Woodie | 80.54 | 84.92 | 87.17 | 91.55 | 93.79 | 98.18 | 100.42 |
| Fibonacci | 85.28 | 87.81 | 89.37 | 91.90 | 94.44 | 96.00 | 98.53 |
| Pivot points | S3 | S2 | S1 | PP | R1 | R2 | R3 |
|---|---|---|---|---|---|---|---|
| Standard | 88.57 | 90.80 | 93.68 | 95.91 | 98.79 | 101.02 | 103.90 |
| Camarilla | 95.16 | 95.62 | 96.09 | 96.56 | 97.03 | 97.50 | 97.97 |
| Woodie | 88.90 | 90.96 | 94.01 | 96.07 | 99.12 | 101.18 | 104.23 |
| Fibonacci | 90.80 | 92.75 | 93.96 | 95.91 | 97.86 | 99.07 | 101.02 |
Numerical data
The following are the details of the technical indicators and moving averages that were collected to generate this technical analysis:
| RSI (14): | 39.40 | |
| MACD (12,26,9): | -1.1200 | |
| Directional Movement: | -12.17 | |
| AROON (14): | -42.86 | |
| DEMA (21): | 91.59 | |
| Parabolic SAR (0,02-0,02-0,2): | 94.67 | |
| Elder Ray (13): | -0.92 | |
| Super Trend (3,10): | 95.78 | |
| Zig ZAG (10): | 90.07 | |
| VORTEX (21): | 0.8100 | |
| Stochastique (14,3,5): | 17.99 | |
| TEMA (21): | 89.79 | |
| Williams %R (14): | -90.30 | |
| Chande Momentum Oscillator (20): | -6.04 | |
| Repulse (5,40,3): | -2.2800 | |
| ROCnROLL: | 2 | |
| TRIX (15,9): | -0.1000 | |
| Courbe Coppock: | 11.79 |
| MA7: | 90.76 | |
| MA20: | 93.68 | |
| MA50: | 93.96 | |
| MA100: | 87.46 | |
| MAexp7: | 91.06 | |
| MAexp20: | 92.72 | |
| MAexp50: | 92.11 | |
| MAexp100: | 87.93 | |
| Price / MA7: | -0.76% | |
| Price / MA20: | -3.85% | |
| Price / MA50: | -4.14% | |
| Price / MA100: | +2.98% | |
| Price / MAexp7: | -1.09% | |
| Price / MAexp20: | -2.86% | |
| Price / MAexp50: | -2.21% | |
| Price / MAexp100: | +2.43% |
News
Don"t forget to follow the news on STARBUCKS CORP.. At the time of publication of this analysis, the latest news was as follows:
- Starbucks Announces Three New Appointments to Board of Directors
-
 What Starbucks tells us about the US economy | FT
-
Why Dunkin' Is Taking On Starbucks And Betting On Coffee
-
Former Starbucks CEO Howard Schultz will not run for president in 2020
-
Starbucks Stock Drops Over Expected Profit Growth Slowing
About author

Online


Add a comment
Comments
0 comments on the analysis STARBUCKS CORP. - Daily