STARBUCKS CORP. - Daily - Technical analysis published on 01/14/2025 (GMT)
- 96
- 0
- Timeframe : Daily
- - Analysis generated on
- Status : NEUTRAL
Summary of the analysis

Additional analysis
Quotes
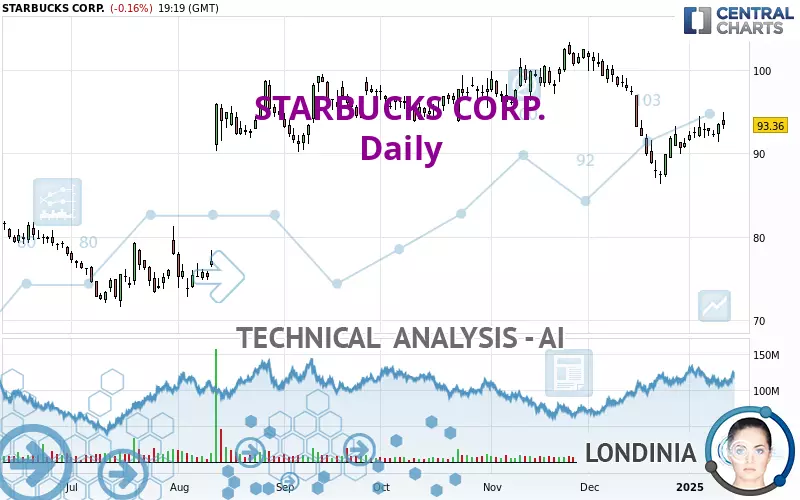
The STARBUCKS CORP. rating is 93.36 USD. On the day, this instrument lost -0.16% and was traded between 92.93 USD and 94.89 USD over the period. The price is currently at +0.46% from its lowest and -1.61% from its highest.The Central Gaps scanner detects the formation of a bullish gap marking the strong presence of buyers against sellers at the opening. This formed a quotation gap.
Opening Gap UP
Type : Bullish
Timeframe : Openning
So that you have an overall view of the price change, here is a table showing the variations over several periods:
New HIGH record (1st january)
Type : Bullish
Timeframe : Weekly
Near a new HIGH record (1 month)
Type : Bullish
Timeframe : Weekly
Technical
Technical analysis of STARBUCKS CORP. in Daily shows an overall slightly bearish trend. 46.43% of the signals given by moving averages are bullish. As the signals currently given by short-term moving averages are rather neutral, the overall trend could quickly return to neutral as well. The Central Indicators scanner detects bullish signals on moving averages that could impact this trend:
Bullish trend reversal : Moving Average 100
Type : Bullish
Timeframe : Daily
Bullish trend reversal : adaptative moving average 20
Type : Bullish
Timeframe : Daily
Bullish trend reversal : adaptative moving average 100
Type : Bullish
Timeframe : Daily
In fact, 13 technical indicators on 18 studied are currently positioned bullish. But beware of excesses. The Central Indicators scanner currently detects this:
Williams %R indicator is overbought : over -20
Type : Neutral
Timeframe : Daily
Price is back over the pivot point
Type : Bullish
Timeframe : Weekly
An analysis of the price chart with the Central Patterns scanner (detector of chart patterns and resistances and supports) shows several results that can have an impact on the price change:
Near horizontal resistance
Type : Bearish
Timeframe : Daily
Near resistance of channel
Type : Bearish
Timeframe : Daily
The Central Candlesticks scanner which studies Japanese candlesticks did not detect anything.
| S3 | S2 | S1 | Price | R1 | R2 | R3 | |
|---|---|---|---|---|---|---|---|
| ProTrendLines | 79.50 | 83.26 | 88.30 | 93.36 | 93.87 | 98.49 | 104.65 |
| Change (%) | -14.85% | -10.82% | -5.42% | - | +0.55% | +5.49% | +12.09% |
| Change | -13.86 | -10.10 | -5.06 | - | +0.51 | +5.13 | +11.29 |
| Level | Intermediate | Minor | Major | - | Major | Major | Major |
To determine price objectives, it is also possible to use the pivot points. Here is the price position in relation to pivot points:
| Pivot points | S3 | S2 | S1 | PP | R1 | R2 | R3 |
|---|---|---|---|---|---|---|---|
| Standard | 89.85 | 90.62 | 92.06 | 92.83 | 94.27 | 95.04 | 96.48 |
| Camarilla | 92.90 | 93.11 | 93.31 | 93.51 | 93.71 | 93.92 | 94.12 |
| Woodie | 90.20 | 90.79 | 92.41 | 93.00 | 94.62 | 95.21 | 96.83 |
| Fibonacci | 90.62 | 91.46 | 91.98 | 92.83 | 93.67 | 94.19 | 95.04 |
| Pivot points | S3 | S2 | S1 | PP | R1 | R2 | R3 |
|---|---|---|---|---|---|---|---|
| Standard | 88.60 | 90.23 | 91.24 | 92.87 | 93.88 | 95.51 | 96.52 |
| Camarilla | 91.52 | 91.77 | 92.01 | 92.25 | 92.49 | 92.73 | 92.98 |
| Woodie | 88.29 | 90.08 | 90.93 | 92.72 | 93.57 | 95.36 | 96.21 |
| Fibonacci | 90.23 | 91.24 | 91.86 | 92.87 | 93.88 | 94.50 | 95.51 |
| Pivot points | S3 | S2 | S1 | PP | R1 | R2 | R3 |
|---|---|---|---|---|---|---|---|
| Standard | 68.39 | 77.34 | 84.30 | 93.25 | 100.21 | 109.16 | 116.12 |
| Camarilla | 86.88 | 88.33 | 89.79 | 91.25 | 92.71 | 94.17 | 95.63 |
| Woodie | 67.39 | 76.84 | 83.30 | 92.75 | 99.21 | 108.66 | 115.12 |
| Fibonacci | 77.34 | 83.42 | 87.18 | 93.25 | 99.33 | 103.09 | 109.16 |
Numerical data
The following is the status of technical indicators and moving averages registered at the time this technical analysis was created:
| RSI (14): | 49.38 | |
| MACD (12,26,9): | -0.8900 | |
| Directional Movement: | 7.47 | |
| AROON (14): | 92.86 | |
| DEMA (21): | 91.68 | |
| Parabolic SAR (0,02-0,02-0,2): | 89.49 | |
| Elder Ray (13): | 1.22 | |
| Super Trend (3,10): | 88.31 | |
| Zig ZAG (10): | 93.47 | |
| VORTEX (21): | 0.8400 | |
| Stochastique (14,3,5): | 81.45 | |
| TEMA (21): | 91.76 | |
| Williams %R (14): | -16.11 | |
| Chande Momentum Oscillator (20): | 3.60 | |
| Repulse (5,40,3): | 0.6800 | |
| ROCnROLL: | -1 | |
| TRIX (15,9): | -0.2400 | |
| Courbe Coppock: | 3.77 |
| MA7: | 92.91 | |
| MA20: | 91.75 | |
| MA50: | 96.17 | |
| MA100: | 95.66 | |
| MAexp7: | 92.83 | |
| MAexp20: | 93.12 | |
| MAexp50: | 94.46 | |
| MAexp100: | 93.47 | |
| Price / MA7: | +0.48% | |
| Price / MA20: | +1.75% | |
| Price / MA50: | -2.92% | |
| Price / MA100: | -2.40% | |
| Price / MAexp7: | +0.57% | |
| Price / MAexp20: | +0.26% | |
| Price / MAexp50: | -1.16% | |
| Price / MAexp100: | -0.12% |
News
The last news published on STARBUCKS CORP. at the time of the generation of this analysis was as follows:
- STARBUCKS INVESTIGATION INITIATED BY FORMER LOUISIANA ATTORNEY GENERAL: Kahn Swick & Foti, LLC Investigates the Officers and Directors of Starbucks Corporation - SBUX
-
 'SERIOUS IMPLICATIONS': Expert warns Amazon, Starbucks strikes will have 'unintended consequences'
-
Starbucks workers speak to FOX Business during nationwide strike #shorts
- STARBUCKS INVESTIGATION INITIATED by Former Louisiana Attorney General: Kahn Swick & Foti, LLC Investigates the Officers and Directors of Starbucks Corporation - SBUX
-
Starbucks workers begin strike ahead of crucial holiday season
About author
Online


Add a comment
Comments
0 comments on the analysis STARBUCKS CORP. - Daily