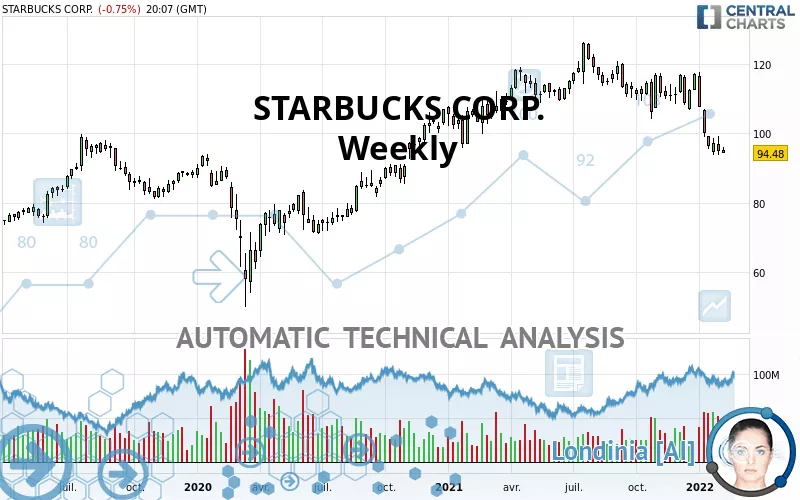
STARBUCKS CORP. - Weekly - Technical analysis published on 02/08/2022 (GMT)
- 350
- 0
Click here for a new analysis!
- Timeframe : Weekly
- - Analysis generated on
- Status : TARGET REACHED

Summary of the analysis

Additional analysis
Quotes
STARBUCKS CORP. rating 94.47 USD. The price registered a decrease of -4.34% over 5 days and was traded between 93.83 USD and 95.94 USD over the period. The price is currently at +0.68% from its lowest point and -1.53% from its highest point.The Central Gaps scanner detects a bullish opening marking the presence of buyers ahead of sellers at the opening but not sufficiently marked to allow the price to register a quotation gap.
Bullish opening
Type : Bullish
Timeframe : Openning
Here is a more detailed summary of the historical variations registered by STARBUCKS CORP.:
Near a new LOW record (1 year)
Type : Bearish
Timeframe : Weekly
Near a new LOW record (1st january)
Type : Bearish
Timeframe : Weekly
Near a new LOW record (1 month)
Type : Bearish
Timeframe : Weekly
Technical
Technical analysis of STARBUCKS CORP. in Weekly shows an overall bearish trend. The signals given by moving averages are 67.86% bearish. This bearish trend is reinforced by the strong signals currently being given by short-term moving averages. There is no crossing of moving average by the price or crossing of moving averages between themselves.
In fact, 12 technical indicators on 18 studied are currently positioned bearish. Caution: the Central Indicators scanner currently detects an excess:
CCI indicator is oversold : under -100
Type : Neutral
Timeframe : Weekly
Williams %R indicator is oversold : under -80
Type : Neutral
Timeframe : Weekly
The Central Patterns scanner, which studies chart patterns, resistances and supports, has identified this signal:
Near horizontal resistance
Type : Bearish
Timeframe : Weekly
The Central Candlesticks scanner, specialised in Japanese candlesticks, did not identify any signals.
| S3 | S2 | S1 | Price | R1 | R2 | R3 | |
|---|---|---|---|---|---|---|---|
| ProTrendLines | 56.31 | 64.04 | 83.45 | 94.47 | 99.11 | 106.25 | 116.95 |
| Change (%) | -40.39% | -32.21% | -11.67% | - | +4.91% | +12.47% | +23.80% |
| Change | -38.16 | -30.43 | -11.02 | - | +4.64 | +11.78 | +22.48 |
| Level | Intermediate | Major | Minor | - | Major | Major | Major |
Attention could also be paid to pivot points to set price objectives:
| Pivot points | S3 | S2 | S1 | PP | R1 | R2 | R3 |
|---|---|---|---|---|---|---|---|
| Standard | 93.45 | 94.16 | 94.68 | 95.39 | 95.91 | 96.62 | 97.14 |
| Camarilla | 94.85 | 94.97 | 95.08 | 95.19 | 95.30 | 95.42 | 95.53 |
| Woodie | 93.35 | 94.11 | 94.58 | 95.34 | 95.81 | 96.57 | 97.04 |
| Fibonacci | 94.16 | 94.63 | 94.92 | 95.39 | 95.86 | 96.15 | 96.62 |
| Pivot points | S3 | S2 | S1 | PP | R1 | R2 | R3 |
|---|---|---|---|---|---|---|---|
| Standard | 87.52 | 90.67 | 92.84 | 95.99 | 98.16 | 101.31 | 103.48 |
| Camarilla | 93.54 | 94.03 | 94.51 | 95.00 | 95.49 | 95.98 | 96.46 |
| Woodie | 87.02 | 90.43 | 92.34 | 95.75 | 97.66 | 101.07 | 102.98 |
| Fibonacci | 90.67 | 92.71 | 93.96 | 95.99 | 98.03 | 99.28 | 101.31 |
| Pivot points | S3 | S2 | S1 | PP | R1 | R2 | R3 |
|---|---|---|---|---|---|---|---|
| Standard | 64.80 | 79.29 | 88.81 | 103.30 | 112.82 | 127.31 | 136.83 |
| Camarilla | 91.72 | 93.92 | 96.12 | 98.32 | 100.52 | 102.72 | 104.92 |
| Woodie | 62.31 | 78.05 | 86.32 | 102.06 | 110.33 | 126.07 | 134.34 |
| Fibonacci | 79.29 | 88.47 | 94.13 | 103.30 | 112.48 | 118.14 | 127.31 |
Numerical data
The following are the details of the technical indicators and moving averages that were collected to generate this technical analysis:
| RSI (14): | 36.29 | |
| MACD (12,26,9): | -4.0300 | |
| Directional Movement: | -16.17 | |
| AROON (14): | -21.42 | |
| DEMA (21): | 101.90 | |
| Parabolic SAR (0,02-0,02-0,2): | 114.22 | |
| Elder Ray (13): | -8.40 | |
| Super Trend (3,10): | 112.18 | |
| Zig ZAG (10): | 94.58 | |
| VORTEX (21): | 0.8400 | |
| Stochastique (14,3,5): | 7.57 | |
| TEMA (21): | 97.19 | |
| Williams %R (14): | -96.58 | |
| Chande Momentum Oscillator (20): | -16.19 | |
| Repulse (5,40,3): | -6.0900 | |
| ROCnROLL: | 2 | |
| TRIX (15,9): | -0.2500 | |
| Courbe Coppock: | 20.19 |
| MA7: | 96.51 | |
| MA20: | 97.79 | |
| MA50: | 106.81 | |
| MA100: | 109.46 | |
| MAexp7: | 99.74 | |
| MAexp20: | 106.10 | |
| MAexp50: | 106.82 | |
| MAexp100: | 100.17 | |
| Price / MA7: | -2.11% | |
| Price / MA20: | -3.40% | |
| Price / MA50: | -11.55% | |
| Price / MA100: | -13.69% | |
| Price / MAexp7: | -5.28% | |
| Price / MAexp20: | -10.96% | |
| Price / MAexp50: | -11.56% | |
| Price / MAexp100: | -5.69% |
News
Don't forget to follow the news on STARBUCKS CORP.. At the time of publication of this analysis, the latest news was as follows:
- Starbucks Reports Q1 Fiscal 2022 Results
- Starbucks Announces Q1 Fiscal Year 2022 Results Conference Call
-
 Starbucks Investors Dismiss Unionization Vote by FX Empire
-
Starbucks Employees To Decide Whether To Form The Chain's First U.S. Union in Buffalo
- Starbucks Declares Quarterly Cash Dividend
About author

Online


Add a comment
Comments
0 comments on the analysis STARBUCKS CORP. - Weekly