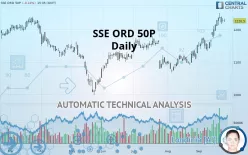
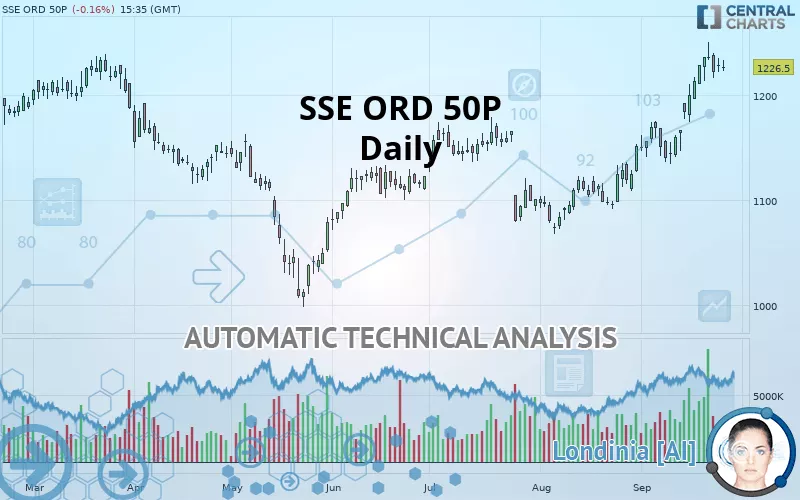
SSE ORD 50P - Daily - Technical analysis published on 09/25/2019 (GMT)
- 235
- 0
- Who voted?
Click here for a new analysis!
- Timeframe : Daily
- - Analysis generated on
- Status : TARGET REACHED
Summary of the analysis

Additional analysis
Quotes
The SSE ORD 50P price is 1,226.5 GBX. On the day, this instrument lost -0.16% with the lowest point at 1,222.0 GBX and the highest point at 1,232.5 GBX. The deviation from the price is +0.37% for the low point and -0.49% for the high point.A bearish opening was detected by the Central Gaps scanner. Sellers are trying to impose a bearish trend in the very short term.
Bearish opening
Type : Bearish
Timeframe : Openning
So that you have an overall view of the price change, here is a table showing the variations over several periods:
Near a new HIGH record (1st january)
Type : Bullish
Timeframe : Weekly
Near a new HIGH record (1 month)
Type : Bullish
Timeframe : Weekly
Technical
A technical analysis in Daily of this SSE ORD 50P chart shows a strongly bullish trend. 92.86% of the signals given by moving averages are bullish. This strongly bullish trend is supported by the strong bullish signals given by short-term moving averages. There is no crossing of moving average by the price or crossing of moving averages between themselves.
The technical indicators are bullish. There is still some doubt about the price increase.
But beware of excesses. The Central Indicators scanner currently detects this:
RSI indicator is overbought : over 70
Type : Neutral
Timeframe : Daily
CCI indicator is overbought : over 100
Type : Neutral
Timeframe : Daily
Williams %R indicator is overbought : over -20
Type : Neutral
Timeframe : Daily
Price is back over the pivot point
Type : Bullish
Timeframe : Daily
Price is back over the pivot point
Type : Bullish
Timeframe : Weekly
The Central Patterns scanner, which studies chart patterns, resistances and supports, has identified this signal:
Near resistance of channel
Type : Bearish
Timeframe : Daily
The presence of a bullish Japanese candlestick pattern detected by Central Candlesticks that could cause a very short term rebound was also detected:
Bullish harami
Type : Bullish
Timeframe : Daily
| S3 | S2 | S1 | Price | R1 | R2 | R3 | |
|---|---|---|---|---|---|---|---|
| ProTrendLines | 1,125.0 | 1,164.4 | 1,182.0 | 1,226.5 | 1,232.5 | 1,321.0 | 1,428.2 |
| Change (%) | -8.28% | -5.06% | -3.63% | - | +0.49% | +7.70% | +16.45% |
| Change | -101.5 | -62.1 | -44.5 | - | +6.0 | +94.5 | +201.7 |
| Level | Intermediate | Major | Intermediate | - | Major | Minor | Intermediate |
To determine price objectives, it is also possible to use the pivot points. Here is the price position in relation to pivot points:
| Pivot points | S3 | S2 | S1 | PP | R1 | R2 | R3 |
|---|---|---|---|---|---|---|---|
| Standard | 1,207.3 | 1,214.2 | 1,221.3 | 1,228.2 | 1,235.3 | 1,242.2 | 1,249.3 |
| Camarilla | 1,224.7 | 1,225.9 | 1,227.2 | 1,228.5 | 1,229.8 | 1,231.1 | 1,232.4 |
| Woodie | 1,207.5 | 1,214.3 | 1,221.5 | 1,228.3 | 1,235.5 | 1,242.3 | 1,249.5 |
| Fibonacci | 1,214.2 | 1,219.5 | 1,222.8 | 1,228.2 | 1,233.5 | 1,236.8 | 1,242.2 |
| Pivot points | S3 | S2 | S1 | PP | R1 | R2 | R3 |
|---|---|---|---|---|---|---|---|
| Standard | 1,113.2 | 1,143.3 | 1,189.7 | 1,219.8 | 1,266.2 | 1,296.3 | 1,342.7 |
| Camarilla | 1,215.0 | 1,222.0 | 1,229.0 | 1,236.0 | 1,243.0 | 1,250.0 | 1,257.0 |
| Woodie | 1,121.3 | 1,147.4 | 1,197.8 | 1,223.9 | 1,274.3 | 1,300.4 | 1,350.8 |
| Fibonacci | 1,143.3 | 1,172.6 | 1,190.6 | 1,219.8 | 1,249.1 | 1,267.1 | 1,296.3 |
| Pivot points | S3 | S2 | S1 | PP | R1 | R2 | R3 |
|---|---|---|---|---|---|---|---|
| Standard | 1,009.8 | 1,038.7 | 1,094.8 | 1,123.7 | 1,179.8 | 1,208.7 | 1,264.8 |
| Camarilla | 1,127.6 | 1,135.4 | 1,143.2 | 1,151.0 | 1,158.8 | 1,166.6 | 1,174.4 |
| Woodie | 1,023.5 | 1,045.5 | 1,108.5 | 1,130.5 | 1,193.5 | 1,215.5 | 1,278.5 |
| Fibonacci | 1,038.7 | 1,071.1 | 1,091.2 | 1,123.7 | 1,156.1 | 1,176.2 | 1,208.7 |
Numerical data
The following are the details of the technical indicators and moving averages that were collected to generate this technical analysis:
| RSI (14): | 71.30 | |
| MACD (12,26,9): | 30.4000 | |
| Directional Movement: | 20.9 | |
| AROON (14): | 57.2 | |
| DEMA (21): | 1,226.1 | |
| Parabolic SAR (0,02-0,02-0,2): | 1,187.3 | |
| Elder Ray (13): | 23.3 | |
| Super Trend (3,10): | 1,178.5 | |
| Zig ZAG (10): | 1,226.5 | |
| VORTEX (21): | 1.2000 | |
| Stochastique (14,3,5): | 79.00 | |
| TEMA (21): | 1,238.6 | |
| Williams %R (14): | -20.20 | |
| Chande Momentum Oscillator (20): | 87.0 | |
| Repulse (5,40,3): | 0.1000 | |
| ROCnROLL: | 1 | |
| TRIX (15,9): | 0.3000 | |
| Courbe Coppock: | 12.70 |
| MA7: | 1,227.0 | |
| MA20: | 1,182.5 | |
| MA50: | 1,132.4 | |
| MA100: | 1,087.1 | |
| MAexp7: | 1,220.0 | |
| MAexp20: | 1,187.6 | |
| MAexp50: | 1,144.9 | |
| MAexp100: | 1,114.6 | |
| Price / MA7: | -0.04% | |
| Price / MA20: | +3.72% | |
| Price / MA50: | +8.31% | |
| Price / MA100: | +12.82% | |
| Price / MAexp7: | +0.53% | |
| Price / MAexp20: | +3.28% | |
| Price / MAexp50: | +7.13% | |
| Price / MAexp100: | +10.04% |
News
The last news published on SSE ORD 50P at the time of the generation of this analysis was as follows:
- iQIYI's RMB 3 Billion Intellectual Property Supply Chain Finance Asset-backed Security Plan Gets Approved by SSE
-
 SSE Composite - Bearish Signals Emerge
-
SSE
-
SSE
-
SSE has support and can power 10% higher
About author

Online


Add a comment
Comments
0 comments on the analysis SSE ORD 50P - Daily