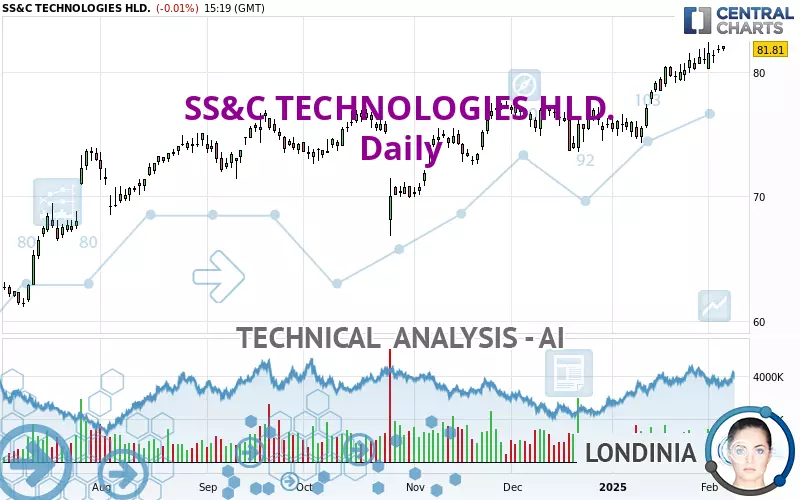
SS&C TECHNOLOGIES HLD. - Daily - Technical analysis published on 02/06/2025 (GMT)
- 84
- 0
Click here for a new analysis!
- Timeframe : Daily
- - Analysis generated on
- Status : TARGET REACHED

Summary of the analysis

Additional analysis
Quotes
The SS&C TECHNOLOGIES HLD. rating is 81.81 USD. The price is lower by -0.01% since the last closing with the lowest point at 81.67 USD and the highest point at 82.10 USD. The deviation from the price is +0.17% for the low point and -0.35% for the high point.So that you have an overall view of the price change, here is a table showing the variations over several periods:
New HIGH record (5 years)
Type : Bullish
Timeframe : Weekly
Near a new HIGH record (1 year)
Type : Bullish
Timeframe : Weekly
Near a new HIGH record (1st january)
Type : Bullish
Timeframe : Weekly
Near a new HIGH record (1 month)
Type : Bullish
Timeframe : Weekly
Technical
Technical analysis of SS&C TECHNOLOGIES HLD. in Daily shows a strongly overall bullish trend. 92.86% of the signals given by moving averages are bullish. This strongly bullish trend is supported by the strong bullish signals given by short-term moving averages. The Central Indicators market scanner currently does not detect any result that concerns moving averages.
In fact, according to the parameters integrated into the Central Analyzer system, 13 technical indicators out of 18 analysed are currently bullish. Caution: the Central Indicators scanner currently detects an excess:
Williams %R indicator is overbought : over -20
Type : Neutral
Timeframe : Daily
Price is back over the pivot point
Type : Bullish
Timeframe : Weekly
An analysis of the price chart with the Central Patterns scanner (detector of chart patterns and resistances and supports) shows several results that can have an impact on the price change:
Near resistance of channel
Type : Bearish
Timeframe : Daily
Near horizontal support
Type : Bullish
Timeframe : Daily
The Central Candlesticks scanner, specialised in Japanese candlesticks, did not identify any signals.
| S3 | S2 | S1 | Price | |
|---|---|---|---|---|
| ProTrendLines | 69.70 | 74.69 | 80.66 | 81.81 |
| Change (%) | -14.80% | -8.70% | -1.41% | - |
| Change | -12.11 | -7.12 | -1.15 | - |
| Level | Intermediate | Major | Major | - |
Pivot points can also be used to set your price objectives. Here is the price situation in relation to pivot points:
| Pivot points | S3 | S2 | S1 | PP | R1 | R2 | R3 |
|---|---|---|---|---|---|---|---|
| Standard | 80.84 | 81.17 | 81.50 | 81.83 | 82.16 | 82.49 | 82.82 |
| Camarilla | 81.64 | 81.70 | 81.76 | 81.82 | 81.88 | 81.94 | 82.00 |
| Woodie | 80.83 | 81.17 | 81.49 | 81.83 | 82.15 | 82.49 | 82.81 |
| Fibonacci | 81.17 | 81.43 | 81.58 | 81.83 | 82.09 | 82.24 | 82.49 |
| Pivot points | S3 | S2 | S1 | PP | R1 | R2 | R3 |
|---|---|---|---|---|---|---|---|
| Standard | 76.87 | 78.08 | 79.51 | 80.72 | 82.15 | 83.36 | 84.79 |
| Camarilla | 80.22 | 80.47 | 80.71 | 80.95 | 81.19 | 81.43 | 81.68 |
| Woodie | 76.99 | 78.14 | 79.63 | 80.78 | 82.27 | 83.42 | 84.91 |
| Fibonacci | 78.08 | 79.09 | 79.71 | 80.72 | 81.73 | 82.35 | 83.36 |
| Pivot points | S3 | S2 | S1 | PP | R1 | R2 | R3 |
|---|---|---|---|---|---|---|---|
| Standard | 68.57 | 71.44 | 76.19 | 79.06 | 83.81 | 86.68 | 91.43 |
| Camarilla | 78.86 | 79.55 | 80.25 | 80.95 | 81.65 | 82.35 | 83.05 |
| Woodie | 69.52 | 71.91 | 77.14 | 79.53 | 84.76 | 87.15 | 92.38 |
| Fibonacci | 71.44 | 74.35 | 76.15 | 79.06 | 81.97 | 83.77 | 86.68 |
Numerical data
The following is the status of the technical indicators and moving averages at the time of publication of this technical analysis:
| RSI (14): | 67.23 | |
| MACD (12,26,9): | 1.4100 | |
| Directional Movement: | 18.81 | |
| AROON (14): | 85.71 | |
| DEMA (21): | 81.35 | |
| Parabolic SAR (0,02-0,02-0,2): | 80.22 | |
| Elder Ray (13): | 1.50 | |
| Super Trend (3,10): | 77.89 | |
| Zig ZAG (10): | 81.82 | |
| VORTEX (21): | 1.1900 | |
| Stochastique (14,3,5): | 83.71 | |
| TEMA (21): | 81.99 | |
| Williams %R (14): | -14.36 | |
| Chande Momentum Oscillator (20): | 3.32 | |
| Repulse (5,40,3): | 0.6500 | |
| ROCnROLL: | 1 | |
| TRIX (15,9): | 0.2300 | |
| Courbe Coppock: | 10.44 |
| MA7: | 81.15 | |
| MA20: | 79.14 | |
| MA50: | 77.35 | |
| MA100: | 75.58 | |
| MAexp7: | 81.09 | |
| MAexp20: | 79.57 | |
| MAexp50: | 77.59 | |
| MAexp100: | 75.42 | |
| Price / MA7: | +0.81% | |
| Price / MA20: | +3.37% | |
| Price / MA50: | +5.77% | |
| Price / MA100: | +8.24% | |
| Price / MAexp7: | +0.89% | |
| Price / MAexp20: | +2.82% | |
| Price / MAexp50: | +5.44% | |
| Price / MAexp100: | +8.47% |
News
The latest news and videos published on SS&C TECHNOLOGIES HLD. at the time of the analysis were as follows:
- SS&C Technologies Acquires FPS Trust
- SS&C Technologies Releases Q3 2024 Earnings Results
- SS&C Technologies Unveils Innovative Solutions at Deliver 2024
- SS&C Technologies Completes Acquisition of Battea-Class Action Services
- SS&C Technologies to Acquire Battea-Class Action Services, Expanding Securities Class Action Claims Management Offerings
About author
Online


Add a comment
Comments
0 comments on the analysis SS&C TECHNOLOGIES HLD. - Daily