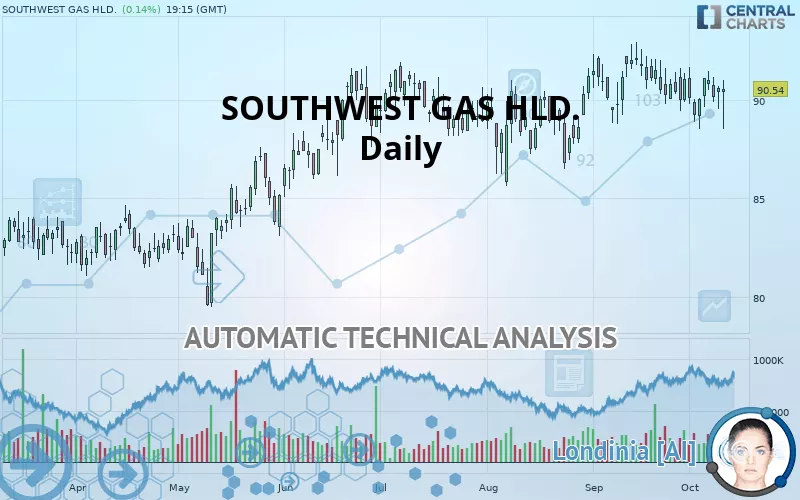
SOUTHWEST GAS HLD. - Daily - Technical analysis published on 10/10/2019 (GMT)
- Who voted?
- 195
- 0
Click here for a new analysis!
- Timeframe : Daily
- - Analysis generated on
- Status : TARGET REACHED
Summary of the analysis

Additional analysis
Quotes
SOUTHWEST GAS HLD. rating 90.54 USD. The price has increased by +0.14% since the last closing and was between 88.50 USD and 90.99 USD. This implies that the price is at +2.31% from its lowest and at -0.49% from its highest.The Central Gaps scanner detects a bearish opening marking the presence of sellers ahead of buyers at the opening but not sufficiently marked to allow the price to register a quotation gap.
Bearish opening
Type : Bearish
Timeframe : Openning
So that you have an overall view of the price change, here is a table showing the variations over several periods:
Near a new HIGH record (5 years)
Type : Bullish
Timeframe : Weekly
Near a new HIGH record (1 year)
Type : Bullish
Timeframe : Weekly
Near a new HIGH record (1st january)
Type : Bullish
Timeframe : Weekly
Near a new HIGH record (1 month)
Type : Bullish
Timeframe : Weekly
Technical
A technical analysis in Daily of this SOUTHWEST GAS HLD. chart shows a strongly bullish trend. 82.14% of the signals given by moving averages are bullish. The slightly bullish signals given by the short-term moving averages show a weakening of the global trend. The Central Indicators market scanner is currently detecting a bearish signal that could impact this trend:
Bearish trend reversal : Moving Average 20
Type : Bearish
Timeframe : Daily
The probability of a further increase is slight given the direction of the technical indicators.
Caution: the Central Indicators scanner currently detects an excess:
MACD indicator: bullish divergence
Type : Bullish
Timeframe : Daily
Williams %R indicator is overbought : over -20
Type : Neutral
Timeframe : Daily
RSI indicator is back over 50
Type : Bullish
Timeframe : Daily
Price is back over the pivot point
Type : Bullish
Timeframe : Weekly
Williams %R indicator is back over -50
Type : Bullish
Timeframe : Daily
No signals are given by Central Patterns, a market scanner specialised in chart patterns, resistances and supports.
The Central Candlesticks scanner which studies Japanese candlesticks did not detect anything.
| S3 | S2 | S1 | Price | R1 | |
|---|---|---|---|---|---|
| ProTrendLines | 83.90 | 86.26 | 89.24 | 90.54 | 91.54 |
| Change (%) | -7.33% | -4.73% | -1.44% | - | +1.10% |
| Change | -6.64 | -4.28 | -1.30 | - | +1.00 |
| Level | Intermediate | Major | Intermediate | - | Major |
To determine price objectives, it is also possible to use the pivot points. Here is the price position in relation to pivot points:
| Pivot points | S3 | S2 | S1 | PP | R1 | R2 | R3 |
|---|---|---|---|---|---|---|---|
| Standard | 88.58 | 89.06 | 89.74 | 90.22 | 90.90 | 91.38 | 92.06 |
| Camarilla | 90.09 | 90.20 | 90.30 | 90.41 | 90.52 | 90.62 | 90.73 |
| Woodie | 88.67 | 89.11 | 89.83 | 90.27 | 90.99 | 91.43 | 92.15 |
| Fibonacci | 89.06 | 89.51 | 89.78 | 90.22 | 90.67 | 90.94 | 91.38 |
| Pivot points | S3 | S2 | S1 | PP | R1 | R2 | R3 |
|---|---|---|---|---|---|---|---|
| Standard | 86.04 | 87.28 | 89.19 | 90.43 | 92.34 | 93.58 | 95.49 |
| Camarilla | 90.24 | 90.53 | 90.82 | 91.11 | 91.40 | 91.69 | 91.98 |
| Woodie | 86.39 | 87.45 | 89.54 | 90.60 | 92.69 | 93.75 | 95.84 |
| Fibonacci | 87.28 | 88.48 | 89.22 | 90.43 | 91.63 | 92.37 | 93.58 |
| Pivot points | S3 | S2 | S1 | PP | R1 | R2 | R3 |
|---|---|---|---|---|---|---|---|
| Standard | 84.69 | 86.72 | 88.88 | 90.91 | 93.07 | 95.10 | 97.26 |
| Camarilla | 89.89 | 90.27 | 90.66 | 91.04 | 91.42 | 91.81 | 92.19 |
| Woodie | 84.76 | 86.75 | 88.95 | 90.94 | 93.14 | 95.13 | 97.33 |
| Fibonacci | 86.72 | 88.32 | 89.31 | 90.91 | 92.51 | 93.50 | 95.10 |
Numerical data
The following are the details of the technical indicators and moving averages that were collected to generate this technical analysis:
| RSI (14): | 51.85 | |
| MACD (12,26,9): | 0.0900 | |
| Directional Movement: | -9.06 | |
| AROON (14): | -100.00 | |
| DEMA (21): | 90.65 | |
| Parabolic SAR (0,02-0,02-0,2): | 91.21 | |
| Elder Ray (13): | -0.76 | |
| Super Trend (3,10): | 87.78 | |
| Zig ZAG (10): | 90.64 | |
| VORTEX (21): | 0.9800 | |
| Stochastique (14,3,5): | 53.26 | |
| TEMA (21): | 90.44 | |
| Williams %R (14): | -39.55 | |
| Chande Momentum Oscillator (20): | 0.37 | |
| Repulse (5,40,3): | 1.6800 | |
| ROCnROLL: | 1 | |
| TRIX (15,9): | 0.0300 | |
| Courbe Coppock: | 1.65 |
| MA7: | 90.38 | |
| MA20: | 90.76 | |
| MA50: | 89.86 | |
| MA100: | 88.95 | |
| MAexp7: | 90.50 | |
| MAexp20: | 90.49 | |
| MAexp50: | 89.92 | |
| MAexp100: | 88.41 | |
| Price / MA7: | +0.18% | |
| Price / MA20: | -0.24% | |
| Price / MA50: | +0.76% | |
| Price / MA100: | +1.79% | |
| Price / MAexp7: | +0.04% | |
| Price / MAexp20: | +0.06% | |
| Price / MAexp50: | +0.69% | |
| Price / MAexp100: | +2.41% |
News
The last news published on SOUTHWEST GAS HLD. at the time of the generation of this analysis was as follows:
- Southwest Gas Holdings, Inc. to Present at American Gas Association 2019 Financial Forum
- Southwest Gas Holdings, Inc. Announces Conference Call
- Southwest Gas Holdings, Inc. Announces First Quarter 2019 Earnings
- Southwest Gas Holdings, Inc. Announces Conference Call
- Southwest Gas Holdings Declares Third Quarter 2019 Dividend
About author

Online


Add a comment
Comments
0 comments on the analysis SOUTHWEST GAS HLD. - Daily