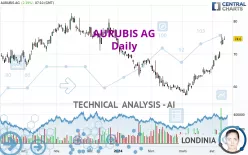
AURUBIS AG - Daily - Technical analysis published on 04/12/2024 (GMT)
- 174
- 0
Click here for a new analysis!
- Timeframe : Daily
- - Analysis generated on
- Status : INVALID

Summary of the analysis

Additional analysis
Quotes
The AURUBIS AG price is 74.60 EUR. On the day, this instrument gained +2.19% and was between 74.30 EUR and 75.40 EUR. This implies that the price is at +0.40% from its lowest and at -1.06% from its highest.The Central Gaps scanner detects a bullish opening marking the presence of buyers ahead of sellers at the opening but not sufficiently marked to allow the price to register a quotation gap.
Bullish opening
Type : Bullish
Timeframe : Openning
So that you have an overall view of the price change, here is a table showing the variations over several periods:
Near a new HIGH record (1st january)
Type : Bullish
Timeframe : Weekly
Near a new HIGH record (1 month)
Type : Bullish
Timeframe : Weekly
Technical
A technical analysis in Daily of this AURUBIS AG chart shows a bullish trend. The signals returned by the moving averages are 71.43% bullish. This bullish trend is reinforced by the strong signals currently being given by short-term moving averages. The Central Indicators scanner does not detect any result on moving averages that would impact this trend.
The probability of a further increase is high given the direction of the technical indicators.
Caution: the Central Indicators scanner currently detects an excess:
RSI indicator is overbought : over 70
Type : Neutral
Timeframe : Daily
CCI indicator is overbought : over 100
Type : Neutral
Timeframe : Daily
Williams %R indicator is overbought : over -20
Type : Neutral
Timeframe : Daily
Pivot points : price is over resistance 1
Type : Neutral
Timeframe : Daily
Pivot points : price is over resistance 2
Type : Neutral
Timeframe : Weekly
An analysis of the price chart with the Central Patterns scanner (detector of chart patterns and resistances and supports) shows a result that can have an impact on the price change:
Resistance of channel is broken
Type : Bullish
Timeframe : Daily
The Central Candlesticks scanner which studies Japanese candlesticks did not detect anything.
| S3 | S2 | S1 | Price | R1 | R2 | R3 | |
|---|---|---|---|---|---|---|---|
| ProTrendLines | 63.70 | 67.28 | 73.11 | 74.60 | 76.46 | 83.39 | 99.54 |
| Change (%) | -14.61% | -9.81% | -2.00% | - | +2.49% | +11.78% | +33.43% |
| Change | -10.90 | -7.32 | -1.49 | - | +1.86 | +8.79 | +24.94 |
| Level | Intermediate | Major | Major | - | Intermediate | Major | Major |
Pivot points can also be used to set your price objectives. Here is the price situation in relation to pivot points:
| Pivot points | S3 | S2 | S1 | PP | R1 | R2 | R3 |
|---|---|---|---|---|---|---|---|
| Standard | 70.08 | 71.47 | 72.23 | 73.62 | 74.38 | 75.77 | 76.53 |
| Camarilla | 72.41 | 72.61 | 72.80 | 73.00 | 73.20 | 73.39 | 73.59 |
| Woodie | 69.78 | 71.31 | 71.93 | 73.46 | 74.08 | 75.61 | 76.23 |
| Fibonacci | 71.47 | 72.29 | 72.80 | 73.62 | 74.44 | 74.95 | 75.77 |
| Pivot points | S3 | S2 | S1 | PP | R1 | R2 | R3 |
|---|---|---|---|---|---|---|---|
| Standard | 61.47 | 63.33 | 65.92 | 67.78 | 70.37 | 72.23 | 74.82 |
| Camarilla | 67.28 | 67.68 | 68.09 | 68.50 | 68.91 | 69.32 | 69.72 |
| Woodie | 61.83 | 63.51 | 66.28 | 67.96 | 70.73 | 72.41 | 75.18 |
| Fibonacci | 63.33 | 65.03 | 66.08 | 67.78 | 69.48 | 70.53 | 72.23 |
| Pivot points | S3 | S2 | S1 | PP | R1 | R2 | R3 |
|---|---|---|---|---|---|---|---|
| Standard | 51.21 | 54.29 | 59.73 | 62.81 | 68.25 | 71.33 | 76.77 |
| Camarilla | 62.84 | 63.62 | 64.40 | 65.18 | 65.96 | 66.74 | 67.52 |
| Woodie | 52.40 | 54.88 | 60.92 | 63.40 | 69.44 | 71.92 | 77.96 |
| Fibonacci | 54.29 | 57.54 | 59.55 | 62.81 | 66.06 | 68.07 | 71.33 |
Numerical data
The following is the status of the technical indicators and moving averages at the time of publication of this technical analysis:
| RSI (14): | 78.95 | |
| MACD (12,26,9): | 2.8600 | |
| Directional Movement: | 38.80 | |
| AROON (14): | 85.71 | |
| DEMA (21): | 71.09 | |
| Parabolic SAR (0,02-0,02-0,2): | 70.00 | |
| Elder Ray (13): | 5.42 | |
| Super Trend (3,10): | 68.94 | |
| Zig ZAG (10): | 74.60 | |
| VORTEX (21): | 1.2800 | |
| Stochastique (14,3,5): | 82.38 | |
| TEMA (21): | 73.53 | |
| Williams %R (14): | -11.84 | |
| Chande Momentum Oscillator (20): | 9.44 | |
| Repulse (5,40,3): | -0.8200 | |
| ROCnROLL: | 1 | |
| TRIX (15,9): | 0.4600 | |
| Courbe Coppock: | 24.20 |
| MA7: | 71.29 | |
| MA20: | 66.90 | |
| MA50: | 63.24 | |
| MA100: | 68.03 | |
| MAexp7: | 71.54 | |
| MAexp20: | 67.78 | |
| MAexp50: | 65.90 | |
| MAexp100: | 67.43 | |
| Price / MA7: | +4.64% | |
| Price / MA20: | +11.51% | |
| Price / MA50: | +17.96% | |
| Price / MA100: | +9.66% | |
| Price / MAexp7: | +4.28% | |
| Price / MAexp20: | +10.06% | |
| Price / MAexp50: | +13.20% | |
| Price / MAexp100: | +10.63% |
News
The latest news and videos published on AURUBIS AG at the time of the analysis were as follows:
- EQS-News: Aurubis employer brand: Employees are our “most valuable element”
- EQS-News: Aurubis AG: Precious metals theft: Verdict announced at Hamburg District Court
- EQS-News: Aurubis: Multimetal provider underscores strategic growth path at Annual General Meeting
- EQS-News: Aurubis: Aurubis and Codelco drive innovation for sustainability in the copper industry: Working together for more metals from responsible production
- EQS-News: Aurubis achieves strong Q1 2023/24 result
About author
Online


Add a comment
Comments
0 comments on the analysis AURUBIS AG - Daily