SOUTHERN COMPANY THE - Daily - Technical analysis published on 06/13/2024 (GMT)
- 115
- 0
Click here for a new analysis!
- Timeframe : Daily
- - Analysis generated on
- Status : LEVEL MAINTAINED

Summary of the analysis

Additional analysis
Quotes
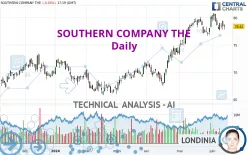
The SOUTHERN COMPANY THE price is 78.42 USD. On the day, this instrument lost -0.03% with the lowest point at 77.81 USD and the highest point at 78.82 USD. The deviation from the price is +0.78% for the low point and -0.51% for the high point.A study of price movements over other periods shows the following variations:
Near a new HIGH record (5 years)
Type : Bullish
Timeframe : Weekly
Near a new HIGH record (1 year)
Type : Bullish
Timeframe : Weekly
Near a new HIGH record (1st january)
Type : Bullish
Timeframe : Weekly
Near a new HIGH record (1 month)
Type : Bullish
Timeframe : Weekly
Technical
Technical analysis of SOUTHERN COMPANY THE in Daily shows a strongly overall bullish trend. 82.14% of the signals given by moving averages are bullish. The slightly bullish signals given by the short-term moving averages show a weakening of the global trend. The Central Indicators market scanner currently does not detect any result that concerns moving averages.
The technical indicators are generally neutral. They do not provide relevant information on the direction of future price movements.
Central Indicators, the scanner specialised in technical indicators, has identified this signal:
Price is back under the pivot point
Type : Bearish
Timeframe : Daily
An analysis of the price chart with the Central Patterns scanner (detector of chart patterns and resistances and supports) shows a result that can have an impact on the price change:
Near horizontal support
Type : Bullish
Timeframe : Daily
The Central Candlesticks scanner which studies Japanese candlesticks did not detect anything.
| S3 | S2 | S1 | Price | R1 | |
|---|---|---|---|---|---|
| ProTrendLines | 71.66 | 75.40 | 77.17 | 78.42 | 80.71 |
| Change (%) | -8.62% | -3.85% | -1.59% | - | +2.92% |
| Change | -6.76 | -3.02 | -1.25 | - | +2.29 |
| Level | Intermediate | Major | Minor | - | Major |
Attention could also be paid to pivot points to set price objectives:
| Pivot points | S3 | S2 | S1 | PP | R1 | R2 | R3 |
|---|---|---|---|---|---|---|---|
| Standard | 76.14 | 76.99 | 77.71 | 78.56 | 79.28 | 80.13 | 80.85 |
| Camarilla | 78.01 | 78.15 | 78.30 | 78.44 | 78.58 | 78.73 | 78.87 |
| Woodie | 76.09 | 76.96 | 77.66 | 78.53 | 79.23 | 80.10 | 80.80 |
| Fibonacci | 76.99 | 77.59 | 77.96 | 78.56 | 79.16 | 79.53 | 80.13 |
| Pivot points | S3 | S2 | S1 | PP | R1 | R2 | R3 |
|---|---|---|---|---|---|---|---|
| Standard | 73.99 | 75.94 | 76.94 | 78.89 | 79.89 | 81.84 | 82.84 |
| Camarilla | 77.13 | 77.40 | 77.67 | 77.94 | 78.21 | 78.48 | 78.75 |
| Woodie | 73.52 | 75.70 | 76.47 | 78.65 | 79.42 | 81.60 | 82.37 |
| Fibonacci | 75.94 | 77.07 | 77.76 | 78.89 | 80.02 | 80.71 | 81.84 |
| Pivot points | S3 | S2 | S1 | PP | R1 | R2 | R3 |
|---|---|---|---|---|---|---|---|
| Standard | 67.35 | 69.95 | 75.04 | 77.64 | 82.73 | 85.33 | 90.42 |
| Camarilla | 78.03 | 78.73 | 79.44 | 80.14 | 80.85 | 81.55 | 82.26 |
| Woodie | 68.61 | 70.57 | 76.30 | 78.26 | 83.99 | 85.95 | 91.68 |
| Fibonacci | 69.95 | 72.88 | 74.70 | 77.64 | 80.57 | 82.39 | 85.33 |
Numerical data
The following is the status of technical indicators and moving averages registered at the time this technical analysis was created:
| RSI (14): | 54.29 | |
| MACD (12,26,9): | 0.8600 | |
| Directional Movement: | 11.01 | |
| AROON (14): | 28.57 | |
| DEMA (21): | 79.62 | |
| Parabolic SAR (0,02-0,02-0,2): | 80.65 | |
| Elder Ray (13): | -0.30 | |
| Super Trend (3,10): | 76.55 | |
| Zig ZAG (10): | 78.43 | |
| VORTEX (21): | 0.9700 | |
| Stochastique (14,3,5): | 43.25 | |
| TEMA (21): | 79.02 | |
| Williams %R (14): | -57.14 | |
| Chande Momentum Oscillator (20): | 0.90 | |
| Repulse (5,40,3): | -0.3500 | |
| ROCnROLL: | -1 | |
| TRIX (15,9): | 0.2300 | |
| Courbe Coppock: | 1.11 |
| MA7: | 78.62 | |
| MA20: | 78.76 | |
| MA50: | 75.14 | |
| MA100: | 71.47 | |
| MAexp7: | 78.65 | |
| MAexp20: | 78.24 | |
| MAexp50: | 75.83 | |
| MAexp100: | 73.19 | |
| Price / MA7: | -0.25% | |
| Price / MA20: | -0.43% | |
| Price / MA50: | +4.37% | |
| Price / MA100: | +9.72% | |
| Price / MAexp7: | -0.29% | |
| Price / MAexp20: | +0.23% | |
| Price / MAexp50: | +3.42% | |
| Price / MAexp100: | +7.15% |
News
Don't forget to follow the news on SOUTHERN COMPANY THE. At the time of publication of this analysis, the latest news was as follows:
- Southern Company Announces Official Partnership With U.S. UNDERRATED Golf Tour
- Local and National Leaders Celebrate ‘Momentous’ Opening of Vogtle Units 3 and 4
- Psychological Safety at Work
- Celebrating AAPI Month: Advancing Leadership Through Innovation
- Southern Company Invests in Johnson Energy Storage
About author
Online


Add a comment
Comments
0 comments on the analysis SOUTHERN COMPANY THE - Daily