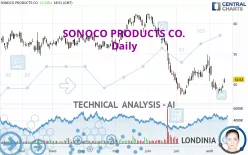
SONOCO PRODUCTS CO. - Daily - Technical analysis published on 08/15/2024 (GMT)
- 103
- 0
Click here for a new analysis!
- Timeframe : Daily
- - Analysis generated on
- Status : INVALID

Summary of the analysis

Additional analysis
Quotes
The SONOCO PRODUCTS CO. rating is 50.83 USD. On the day, this instrument gained +2.13% with the lowest point at 50.26 USD and the highest point at 51.10 USD. The deviation from the price is +1.13% for the low point and -0.53% for the high point.A bullish gap was detected at the opening by the Central Gaps scanner. There are a lot of buyers and they have the upper hand in the very short term.
Opening Gap UP
Type : Bullish
Timeframe : Openning
A study of price movements over other periods shows the following variations:
Near a new LOW record (1 month)
Type : Bearish
Timeframe : Weekly
Technical
Technical analysis of SONOCO PRODUCTS CO. in Daily shows an overall bearish trend. 75.00% of the signals given by moving averages are bearish. Caution: the neutral signals currently given by short-term moving averages show us that the global trend is losing momentum. The Central Indicators scanner detects bullish signals on moving averages that could impact this trend:
Bullish price crossover with Moving Average 20
Type : Bullish
Timeframe : Daily
Bullish price crossover with adaptative moving average 20
Type : Bullish
Timeframe : Daily
In fact, Central Analyzer took into account 18 technical indicators and the result was as follows: 6 are bullish, 6 are neutral and 6 are bearish. Central Indicators, the scanner specialised in technical indicators, has identified these signals:
Pivot points : price is over resistance 1
Type : Neutral
Timeframe : Weekly
Pivot points : price is over resistance 3
Type : Neutral
Timeframe : Daily
RSI indicator is back over 50
Type : Bullish
Timeframe : Daily
MACD crosses UP its Moving Average
Type : Bullish
Timeframe : Daily
Central Patterns, the scanner specializing in chart patterns, did not identify any signals.
The presence of a bullish Japanese candlestick pattern detected by Central Candlesticks that could cause a very short term rebound was also detected:
Upside gap
Type : Bullish
Timeframe : Daily
| S3 | S2 | S1 | Price | R1 | R2 | R3 | |
|---|---|---|---|---|---|---|---|
| ProTrendLines | 38.58 | 43.48 | 48.21 | 50.83 | 51.66 | 53.35 | 54.59 |
| Change (%) | -24.10% | -14.46% | -5.15% | - | +1.63% | +4.96% | +7.40% |
| Change | -12.25 | -7.35 | -2.62 | - | +0.83 | +2.52 | +3.76 |
| Level | Minor | Minor | Major | - | Intermediate | Minor | Major |
To determine price objectives, it is also possible to use the pivot points. Here is the price position in relation to pivot points:
| Pivot points | S3 | S2 | S1 | PP | R1 | R2 | R3 |
|---|---|---|---|---|---|---|---|
| Standard | 48.70 | 49.03 | 49.40 | 49.73 | 50.10 | 50.43 | 50.80 |
| Camarilla | 49.58 | 49.64 | 49.71 | 49.77 | 49.83 | 49.90 | 49.96 |
| Woodie | 48.72 | 49.04 | 49.42 | 49.74 | 50.12 | 50.44 | 50.82 |
| Fibonacci | 49.03 | 49.30 | 49.46 | 49.73 | 50.00 | 50.16 | 50.43 |
| Pivot points | S3 | S2 | S1 | PP | R1 | R2 | R3 |
|---|---|---|---|---|---|---|---|
| Standard | 46.40 | 47.45 | 48.22 | 49.27 | 50.04 | 51.09 | 51.86 |
| Camarilla | 48.49 | 48.66 | 48.82 | 48.99 | 49.16 | 49.32 | 49.49 |
| Woodie | 46.26 | 47.38 | 48.08 | 49.20 | 49.90 | 51.02 | 51.72 |
| Fibonacci | 47.45 | 48.15 | 48.58 | 49.27 | 49.97 | 50.40 | 51.09 |
| Pivot points | S3 | S2 | S1 | PP | R1 | R2 | R3 |
|---|---|---|---|---|---|---|---|
| Standard | 42.66 | 45.18 | 49.27 | 51.79 | 55.88 | 58.40 | 62.49 |
| Camarilla | 51.53 | 52.14 | 52.74 | 53.35 | 53.96 | 54.56 | 55.17 |
| Woodie | 43.44 | 45.57 | 50.05 | 52.18 | 56.66 | 58.79 | 63.27 |
| Fibonacci | 45.18 | 47.71 | 49.27 | 51.79 | 54.32 | 55.88 | 58.40 |
Numerical data
The following is the status of the technical indicators and moving averages at the time of publication of this technical analysis:
| RSI (14): | 50.73 | |
| MACD (12,26,9): | -0.6400 | |
| Directional Movement: | 0.50 | |
| AROON (14): | -50.00 | |
| DEMA (21): | 49.43 | |
| Parabolic SAR (0,02-0,02-0,2): | 51.85 | |
| Elder Ray (13): | 0.63 | |
| Super Trend (3,10): | 53.04 | |
| Zig ZAG (10): | 50.82 | |
| VORTEX (21): | 1.0000 | |
| Stochastique (14,3,5): | 25.43 | |
| TEMA (21): | 49.71 | |
| Williams %R (14): | -60.14 | |
| Chande Momentum Oscillator (20): | -1.81 | |
| Repulse (5,40,3): | 1.2900 | |
| ROCnROLL: | -1 | |
| TRIX (15,9): | -0.1800 | |
| Courbe Coppock: | 8.10 |
| MA7: | 49.40 | |
| MA20: | 50.65 | |
| MA50: | 52.09 | |
| MA100: | 54.68 | |
| MAexp7: | 49.87 | |
| MAexp20: | 50.35 | |
| MAexp50: | 51.92 | |
| MAexp100: | 53.37 | |
| Price / MA7: | +2.89% | |
| Price / MA20: | +0.36% | |
| Price / MA50: | -2.42% | |
| Price / MA100: | -7.04% | |
| Price / MAexp7: | +1.93% | |
| Price / MAexp20: | +0.95% | |
| Price / MAexp50: | -2.10% | |
| Price / MAexp100: | -4.76% |
News
Don't forget to follow the news on SONOCO PRODUCTS CO.. At the time of publication of this analysis, the latest news was as follows:
- Sonoco Products Company to Host Earnings Call
-
 Sonoco Products
- Sonoco Implementing Price Increase for Paperboard Tubes and Cores
- Sonoco Implementing Price Increase for All Uncoated Recycled Paperboard Products
- Sonoco Announces Quarterly Conference Calls and Webcasts for 2017
About author

Online


Add a comment
Comments
0 comments on the analysis SONOCO PRODUCTS CO. - Daily