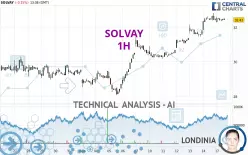
SOLVAY - 1H - Technical analysis published on 02/17/2025 (GMT)
- 109
- 0
Click here for a new analysis!
- Timeframe : 1H
- - Analysis generated on
- Status : LEVEL MAINTAINED

Summary of the analysis

Additional analysis
Quotes
The SOLVAY price is 32.43 EUR. The price is lower by -0.15% since the last closing and was between 32.28 EUR and 32.61 EUR. This implies that the price is at +0.46% from its lowest and at -0.55% from its highest.A bearish opening was detected by the Central Gaps scanner. Sellers are trying to impose a bearish trend in the very short term.
Bearish opening
Type : Bearish
Timeframe : Openning
A study of price movements over other periods shows the following variations:
Near a new HIGH record (1st january)
Type : Bullish
Timeframe : Weekly
Near a new HIGH record (1 month)
Type : Bullish
Timeframe : Weekly
Technical
Technical analysis of this 1H chart of SOLVAY indicates that the overall trend is strongly bullish. The signals given by the moving averages are 92.86% bullish. This strong bullish trend is confirmed by the strong signals currently being given by short-term moving averages. There is no crossing of moving average by the price or crossing of moving averages between themselves.
An assessment of technical indicators shows a slightly bullish signal.
Central Indicators, the detector scanner for these technical indicators has recently detected several signals:
Momentum indicator is back under 0
Type : Bearish
Timeframe : 1 hour
Williams %R indicator is back under -50
Type : Bearish
Timeframe : 1 hour
Central Patterns, the market scanner focusing on chart patterns, resistances and supports found this result:
Near support of channel
Type : Bullish
Timeframe : 1 hour
Central Candlesticks, the scanner specialised in Japanese candlesticks, detects this inversion signal that could impact the current short-term trend:
Doji
Type : Neutral
Timeframe : 1 hour
| S3 | S2 | S1 | Price | R1 | R2 | R3 | |
|---|---|---|---|---|---|---|---|
| ProTrendLines | 29.85 | 30.70 | 31.67 | 32.43 | 33.57 | 34.82 | 36.77 |
| Change (%) | -7.96% | -5.33% | -2.34% | - | +3.52% | +7.37% | +13.38% |
| Change | -2.58 | -1.73 | -0.76 | - | +1.14 | +2.39 | +4.34 |
| Level | Major | Minor | Intermediate | - | Intermediate | Minor | Minor |
Attention could also be paid to pivot points to set price objectives:
| Pivot points | S3 | S2 | S1 | PP | R1 | R2 | R3 |
|---|---|---|---|---|---|---|---|
| Standard | 30.98 | 31.41 | 31.95 | 32.38 | 32.92 | 33.35 | 33.89 |
| Camarilla | 32.21 | 32.30 | 32.39 | 32.48 | 32.57 | 32.66 | 32.75 |
| Woodie | 31.03 | 31.44 | 32.00 | 32.41 | 32.97 | 33.38 | 33.94 |
| Fibonacci | 31.41 | 31.78 | 32.01 | 32.38 | 32.75 | 32.98 | 33.35 |
| Pivot points | S3 | S2 | S1 | PP | R1 | R2 | R3 |
|---|---|---|---|---|---|---|---|
| Standard | 28.19 | 29.19 | 30.83 | 31.83 | 33.47 | 34.47 | 36.11 |
| Camarilla | 31.75 | 32.00 | 32.24 | 32.48 | 32.72 | 32.96 | 33.21 |
| Woodie | 28.52 | 29.35 | 31.16 | 31.99 | 33.80 | 34.63 | 36.44 |
| Fibonacci | 29.19 | 30.20 | 30.82 | 31.83 | 32.84 | 33.46 | 34.47 |
| Pivot points | S3 | S2 | S1 | PP | R1 | R2 | R3 |
|---|---|---|---|---|---|---|---|
| Standard | 25.06 | 26.69 | 28.12 | 29.75 | 31.18 | 32.81 | 34.24 |
| Camarilla | 28.70 | 28.98 | 29.26 | 29.54 | 29.82 | 30.10 | 30.38 |
| Woodie | 24.95 | 26.64 | 28.01 | 29.70 | 31.07 | 32.76 | 34.13 |
| Fibonacci | 26.69 | 27.86 | 28.58 | 29.75 | 30.92 | 31.64 | 32.81 |
Numerical data
The following is the status of the technical indicators and moving averages at the time of publication of this technical analysis:
| RSI (14): | 67.73 | |
| MACD (12,26,9): | 0.3100 | |
| Directional Movement: | 29.05 | |
| AROON (14): | 50.00 | |
| DEMA (21): | 32.68 | |
| Parabolic SAR (0,02-0,02-0,2): | 32.36 | |
| Elder Ray (13): | 0.12 | |
| Super Trend (3,10): | 32.02 | |
| Zig ZAG (10): | 32.48 | |
| VORTEX (21): | 1.1500 | |
| Stochastique (14,3,5): | 56.22 | |
| TEMA (21): | 32.64 | |
| Williams %R (14): | -64.81 | |
| Chande Momentum Oscillator (20): | -0.02 | |
| Repulse (5,40,3): | 0.0600 | |
| ROCnROLL: | 1 | |
| TRIX (15,9): | 0.1700 | |
| Courbe Coppock: | 3.13 |
| MA7: | 31.37 | |
| MA20: | 30.22 | |
| MA50: | 30.12 | |
| MA100: | 32.09 | |
| MAexp7: | 32.45 | |
| MAexp20: | 32.23 | |
| MAexp50: | 31.56 | |
| MAexp100: | 30.88 | |
| Price / MA7: | +3.38% | |
| Price / MA20: | +7.31% | |
| Price / MA50: | +7.67% | |
| Price / MA100: | +1.06% | |
| Price / MAexp7: | -0.06% | |
| Price / MAexp20: | +0.62% | |
| Price / MAexp50: | +2.76% | |
| Price / MAexp100: | +5.02% |
News
Don't forget to follow the news on SOLVAY. At the time of publication of this analysis, the latest news was as follows:
- Solvay third quarter 2024 results
- Participation notification by BNP Paribas Asset Management
- Solvay opens consultation to cease production at Salindres site
- Solvay: acquisition of own shares
- Solvay starts a new share buyback program to cover its long-term incentive plans
About author
Online


Add a comment
Comments
0 comments on the analysis SOLVAY - 1H