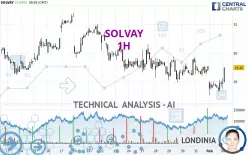
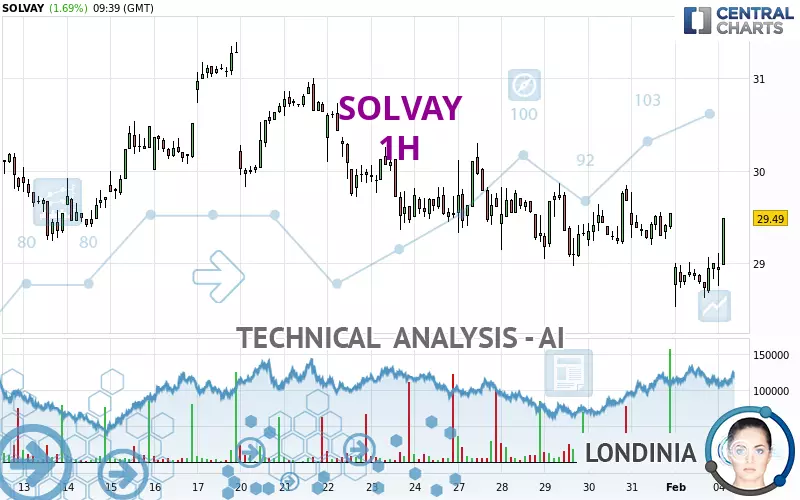
SOLVAY - 1H - Technical analysis published on 02/04/2025 (GMT)
- 77
- 0
- Timeframe : 1H
- - Analysis generated on
- Status : NEUTRAL
Summary of the analysis

Additional analysis
Quotes
SOLVAY rating 29.49 EUR. The price registered an increase of +1.69% on the session and was traded between 28.76 EUR and 29.49 EUR over the period. The price is currently at +2.54% from its lowest and 0% from its highest.So that you have an overall view of the price change, here is a table showing the variations over several periods:
Near a new LOW record (1st january)
Type : Bearish
Timeframe : Weekly
Near a new LOW record (1 month)
Type : Bearish
Timeframe : Weekly
Technical
Technical analysis of SOLVAY in 1H shows a neutral overall trend. This indecision could turn into a bullish trend due to the slightly bullish signals currently given by short-term moving averages. The Central Indicators scanner detects bullish signals on moving averages that could impact this trend:
Bullish price crossover with Moving Average 20
Type : Bullish
Timeframe : 1 hour
Bullish price crossover with Moving Average 50
Type : Bullish
Timeframe : 1 hour
Bullish price crossover with adaptative moving average 20
Type : Bullish
Timeframe : 1 hour
Bullish price crossover with adaptative moving average 100
Type : Bullish
Timeframe : 1 hour
The probability of a further increase are moderate given the direction of the technical indicators.
But beware of excesses. The Central Indicators scanner currently detects this:
Williams %R indicator is overbought : over -20
Type : Neutral
Timeframe : 1 hour
Pivot points : price is over resistance 1
Type : Neutral
Timeframe : 1 hour
RSI indicator is back over 50
Type : Bullish
Timeframe : 1 hour
MACD crosses UP its Moving Average
Type : Bullish
Timeframe : 1 hour
The analysis of the price chart with Central Patterns scanners does not return any result.
The Central Candlesticks scanner which studies Japanese candlesticks did not detect anything.
| S3 | S2 | S1 | Price | R1 | R2 | R3 | |
|---|---|---|---|---|---|---|---|
| ProTrendLines | 28.53 | 29.01 | 29.25 | 29.49 | 29.84 | 30.30 | 31.00 |
| Change (%) | -3.26% | -1.63% | -0.81% | - | +1.19% | +2.75% | +5.12% |
| Change | -0.96 | -0.48 | -0.24 | - | +0.35 | +0.81 | +1.51 |
| Level | Intermediate | Major | Minor | - | Major | Minor | Minor |
Pivot points can also be used to set your price objectives. Here is the price situation in relation to pivot points:
| Pivot points | S3 | S2 | S1 | PP | R1 | R2 | R3 |
|---|---|---|---|---|---|---|---|
| Standard | 28.12 | 28.33 | 28.66 | 28.87 | 29.20 | 29.41 | 29.74 |
| Camarilla | 28.85 | 28.90 | 28.95 | 29.00 | 29.05 | 29.10 | 29.15 |
| Woodie | 28.19 | 28.36 | 28.73 | 28.90 | 29.27 | 29.44 | 29.81 |
| Fibonacci | 28.33 | 28.53 | 28.66 | 28.87 | 29.07 | 29.20 | 29.41 |
| Pivot points | S3 | S2 | S1 | PP | R1 | R2 | R3 |
|---|---|---|---|---|---|---|---|
| Standard | 27.58 | 28.27 | 28.91 | 29.60 | 30.24 | 30.93 | 31.57 |
| Camarilla | 29.17 | 29.30 | 29.42 | 29.54 | 29.66 | 29.78 | 29.91 |
| Woodie | 27.55 | 28.26 | 28.88 | 29.59 | 30.21 | 30.92 | 31.54 |
| Fibonacci | 28.27 | 28.78 | 29.10 | 29.60 | 30.11 | 30.43 | 30.93 |
| Pivot points | S3 | S2 | S1 | PP | R1 | R2 | R3 |
|---|---|---|---|---|---|---|---|
| Standard | 25.06 | 26.69 | 28.12 | 29.75 | 31.18 | 32.81 | 34.24 |
| Camarilla | 28.70 | 28.98 | 29.26 | 29.54 | 29.82 | 30.10 | 30.38 |
| Woodie | 24.95 | 26.64 | 28.01 | 29.70 | 31.07 | 32.76 | 34.13 |
| Fibonacci | 26.69 | 27.86 | 28.58 | 29.75 | 30.92 | 31.64 | 32.81 |
Numerical data
The following are the details of the technical indicators and moving averages that were collected to generate this technical analysis:
| RSI (14): | 57.71 | |
| MACD (12,26,9): | -0.1000 | |
| Directional Movement: | 5.15 | |
| AROON (14): | -21.43 | |
| DEMA (21): | 28.99 | |
| Parabolic SAR (0,02-0,02-0,2): | 29.61 | |
| Elder Ray (13): | 0.16 | |
| Super Trend (3,10): | 28.40 | |
| Zig ZAG (10): | 29.49 | |
| VORTEX (21): | 0.9900 | |
| Stochastique (14,3,5): | 60.78 | |
| TEMA (21): | 28.98 | |
| Williams %R (14): | -5.88 | |
| Chande Momentum Oscillator (20): | 0.07 | |
| Repulse (5,40,3): | 2.8900 | |
| ROCnROLL: | 1 | |
| TRIX (15,9): | -0.0600 | |
| Courbe Coppock: | 2.86 |
| MA7: | 29.42 | |
| MA20: | 29.53 | |
| MA50: | 30.07 | |
| MA100: | 32.21 | |
| MAexp7: | 29.08 | |
| MAexp20: | 29.13 | |
| MAexp50: | 29.32 | |
| MAexp100: | 29.48 | |
| Price / MA7: | +0.24% | |
| Price / MA20: | -0.14% | |
| Price / MA50: | -1.93% | |
| Price / MA100: | -8.44% | |
| Price / MAexp7: | +1.41% | |
| Price / MAexp20: | +1.24% | |
| Price / MAexp50: | +0.58% | |
| Price / MAexp100: | +0.03% |
News
Don't forget to follow the news on SOLVAY. At the time of publication of this analysis, the latest news was as follows:
- Solvay third quarter 2024 results
- Participation notification by BNP Paribas Asset Management
- Solvay opens consultation to cease production at Salindres site
- Solvay: acquisition of own shares
- Solvay starts a new share buyback program to cover its long-term incentive plans
About author
Online


Add a comment
Comments
0 comments on the analysis SOLVAY - 1H