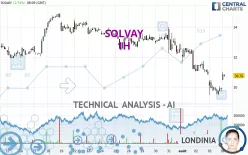
SOLVAY - 1H - Technical analysis published on 08/06/2024 (GMT)
- 142
- 0
Click here for a new analysis!
- Timeframe : 1H
- - Analysis generated on
- Status : LEVEL MAINTAINED

Summary of the analysis

Additional analysis
Quotes
SOLVAY rating 30.76 EUR. The price has increased by +2.74% since the last closing and was traded between 30.46 EUR and 31.01 EUR over the period. The price is currently at +0.98% from its lowest and -0.81% from its highest.The Central Gaps scanner detects the formation of a bullish gap marking the strong presence of buyers against sellers at the opening. This formed a quotation gap.
Opening Gap UP
Type : Bullish
Timeframe : Openning
So that you have an overall view of the price change, here is a table showing the variations over several periods:
Near a new LOW record (1 month)
Type : Bearish
Timeframe : Weekly
Technical
Technical analysis of SOLVAY in 1H shows an overall bearish trend. 75.00% of the signals given by moving averages are bearish. Caution: as the signals currently given by short-term moving averages are rather neutral, the bearish trend could slow down. An assessment of moving averages reveals a bullish signal that could impact this trend:
Bullish trend reversal : adaptative moving average 20
Type : Bullish
Timeframe : 1 hour
An assessment of technical indicators does not currently provide any relevant information on the direction of future price movements.
Other results related to technical indicators were also found by the Central Indicators scanner:
Pivot points : price is over resistance 1
Type : Neutral
Timeframe : 1 hour
MACD crosses UP its Moving Average
Type : Bullish
Timeframe : 1 hour
Williams %R indicator is back over -50
Type : Bullish
Timeframe : 1 hour
No signals are given by Central Patterns, a market scanner specialised in chart patterns, resistances and supports.
For a small setback in the very short term, the Central Candlesticks scanner currently notes the presence of this bearish pattern in Japanese candlesticks:
Bearish harami
Type : Bearish
Timeframe : 1 hour
Bearish harami cross
Type : Bearish
Timeframe : 1 hour
| S3 | S2 | S1 | Price | R1 | R2 | R3 | |
|---|---|---|---|---|---|---|---|
| ProTrendLines | 26.65 | 29.03 | 29.50 | 30.76 | 30.79 | 32.04 | 32.91 |
| Change (%) | -13.36% | -5.62% | -4.10% | - | +0.10% | +4.16% | +6.99% |
| Change | -4.11 | -1.73 | -1.26 | - | +0.03 | +1.28 | +2.15 |
| Level | Major | Minor | Intermediate | - | Intermediate | Intermediate | Minor |
To determine price objectives, it is also possible to use the pivot points. Here is the price position in relation to pivot points:
| Pivot points | S3 | S2 | S1 | PP | R1 | R2 | R3 |
|---|---|---|---|---|---|---|---|
| Standard | 28.44 | 28.95 | 29.45 | 29.96 | 30.46 | 30.97 | 31.47 |
| Camarilla | 29.66 | 29.76 | 29.85 | 29.94 | 30.03 | 30.13 | 30.22 |
| Woodie | 28.43 | 28.95 | 29.44 | 29.96 | 30.45 | 30.97 | 31.46 |
| Fibonacci | 28.95 | 29.34 | 29.58 | 29.96 | 30.35 | 30.59 | 30.97 |
| Pivot points | S3 | S2 | S1 | PP | R1 | R2 | R3 |
|---|---|---|---|---|---|---|---|
| Standard | 26.67 | 28.77 | 29.81 | 31.91 | 32.95 | 35.05 | 36.09 |
| Camarilla | 30.00 | 30.28 | 30.57 | 30.86 | 31.15 | 31.44 | 31.72 |
| Woodie | 26.15 | 28.51 | 29.29 | 31.65 | 32.43 | 34.79 | 35.57 |
| Fibonacci | 28.77 | 29.97 | 30.71 | 31.91 | 33.11 | 33.85 | 35.05 |
| Pivot points | S3 | S2 | S1 | PP | R1 | R2 | R3 |
|---|---|---|---|---|---|---|---|
| Standard | 28.02 | 29.89 | 31.20 | 33.07 | 34.38 | 36.25 | 37.56 |
| Camarilla | 31.65 | 31.94 | 32.23 | 32.52 | 32.81 | 33.10 | 33.40 |
| Woodie | 27.75 | 29.75 | 30.93 | 32.93 | 34.11 | 36.11 | 37.29 |
| Fibonacci | 29.89 | 31.10 | 31.85 | 33.07 | 34.28 | 35.03 | 36.25 |
Numerical data
The following is the status of the technical indicators and moving averages at the time of publication of this technical analysis:
| RSI (14): | 47.54 | |
| MACD (12,26,9): | -0.4900 | |
| Directional Movement: | -4.76 | |
| AROON (14): | -71.43 | |
| DEMA (21): | 29.95 | |
| Parabolic SAR (0,02-0,02-0,2): | 29.48 | |
| Elder Ray (13): | 0.37 | |
| Super Trend (3,10): | 30.89 | |
| Zig ZAG (10): | 30.79 | |
| VORTEX (21): | 0.9200 | |
| Stochastique (14,3,5): | 52.55 | |
| TEMA (21): | 29.93 | |
| Williams %R (14): | -23.12 | |
| Chande Momentum Oscillator (20): | -0.23 | |
| Repulse (5,40,3): | 1.1400 | |
| ROCnROLL: | -1 | |
| TRIX (15,9): | -0.2800 | |
| Courbe Coppock: | 7.14 |
| MA7: | 31.70 | |
| MA20: | 32.72 | |
| MA50: | 32.52 | |
| MA100: | 30.87 | |
| MAexp7: | 30.33 | |
| MAexp20: | 30.64 | |
| MAexp50: | 31.53 | |
| MAexp100: | 32.21 | |
| Price / MA7: | -2.97% | |
| Price / MA20: | -5.99% | |
| Price / MA50: | -5.41% | |
| Price / MA100: | -0.36% | |
| Price / MAexp7: | +1.42% | |
| Price / MAexp20: | +0.39% | |
| Price / MAexp50: | -2.44% | |
| Price / MAexp100: | -4.50% |
News
The latest news and videos published on SOLVAY at the time of the analysis were as follows:
- Solvay starts a new share buyback program to cover its long-term incentive plans
- Solvay second quarter 2024 results
- Solvay and Cyclic Materials sign supply agreement for recycled mixed rare earth oxide (EN / FR)
- Participation notifications by BNP Paribas Asset Management SA
- Solvay first quarter 2024 results
About author
Online


Add a comment
Comments
0 comments on the analysis SOLVAY - 1H