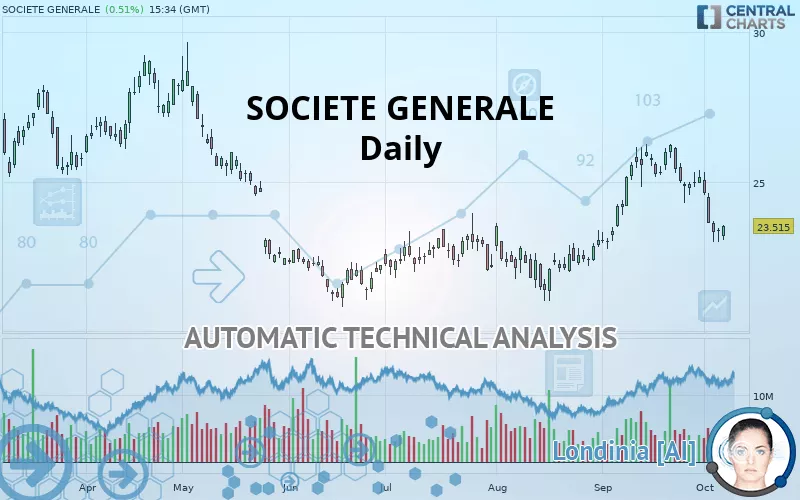
SOCIETE GENERALE - Daily - Technical analysis published on 10/07/2019 (GMT)
- 491
- 0
- Who voted?
Click here for a new analysis!
- Timeframe : Daily
- - Analysis generated on
- Status : INVALID

Summary of the analysis

Additional analysis
Quotes
The SOCIETE GENERALE rating is 23.515 EUR. The price registered an increase of +0.51% on the session with the lowest point at 23.035 EUR and the highest point at 23.560 EUR. The deviation from the price is +2.08% for the low point and -0.19% for the high point.The Central Gaps scanner detects a bearish opening marking the presence of sellers ahead of buyers at the opening but not sufficiently marked to allow the price to register a quotation gap.
Bearish opening
Type : Bearish
Timeframe : Openning
A study of price movements over other periods shows the following variations:
Near a new LOW record (1 month)
Type : Bearish
Timeframe : Weekly
Technical
A technical analysis in Daily of this SOCIETE GENERALE chart shows a neutral trend. This indecision could turn into a bearish trend due to the strong bearish signals currently being given by short-term moving averages. There is no crossing of moving average by the price or crossing of moving averages between themselves.
An assessment of technical indicators does not currently provide any relevant information on the direction of future price movements.
Caution: the Central Indicators scanner currently detects an excess:
CCI indicator is oversold : under -100
Type : Neutral
Timeframe : Daily
Previous candle closed under Bollinger bands
Type : Neutral
Timeframe : Daily
Williams %R indicator is oversold : under -80
Type : Neutral
Timeframe : Daily
Ichimoku - Bearish crossover : Tenkan & Kijun
Type : Bearish
Timeframe : Daily
Price is back under the pivot point
Type : Bearish
Timeframe : Weekly
An analysis of the price chart with the Central Patterns scanner (detector of chart patterns and resistances and supports) shows several results that can have an impact on the price change:
Near horizontal support
Type : Bullish
Timeframe : Daily
Support of channel is broken
Type : Bearish
Timeframe : Daily
The presence of these Japanese chandelier patterns detected by Central Candlesticks that could impact the current short-term trend were also noted:
Bullish harami
Type : Bullish
Timeframe : Daily
Doji
Type : Neutral
Timeframe : Daily
| S2 | S1 | Price | R1 | R2 | R3 | |
|---|---|---|---|---|---|---|
| ProTrendLines | 21.179 | 22.765 | 23.515 | 23.690 | 26.187 | 29.015 |
| Change (%) | -9.93% | -3.19% | - | +0.74% | +11.36% | +23.39% |
| Change | -2.336 | -0.750 | - | +0.175 | +2.672 | +5.500 |
| Level | Major | Intermediate | - | Intermediate | Major | Intermediate |
Pivot points can also be used to set your price objectives. Here is the price situation in relation to pivot points:
| Pivot points | S3 | S2 | S1 | PP | R1 | R2 | R3 |
|---|---|---|---|---|---|---|---|
| Standard | 22.615 | 22.795 | 23.095 | 23.275 | 23.575 | 23.755 | 24.055 |
| Camarilla | 23.263 | 23.307 | 23.351 | 23.395 | 23.439 | 23.483 | 23.527 |
| Woodie | 22.675 | 22.825 | 23.155 | 23.305 | 23.635 | 23.785 | 24.115 |
| Fibonacci | 22.795 | 22.978 | 23.092 | 23.275 | 23.458 | 23.572 | 23.755 |
| Pivot points | S3 | S2 | S1 | PP | R1 | R2 | R3 |
|---|---|---|---|---|---|---|---|
| Standard | 20.028 | 21.502 | 22.448 | 23.922 | 24.868 | 26.342 | 27.288 |
| Camarilla | 22.730 | 22.951 | 23.173 | 23.395 | 23.617 | 23.839 | 24.061 |
| Woodie | 19.765 | 21.370 | 22.185 | 23.790 | 24.605 | 26.210 | 27.025 |
| Fibonacci | 21.502 | 22.426 | 22.997 | 23.922 | 24.846 | 25.417 | 26.342 |
| Pivot points | S3 | S2 | S1 | PP | R1 | R2 | R3 |
|---|---|---|---|---|---|---|---|
| Standard | 19.687 | 21.223 | 23.182 | 24.718 | 26.677 | 28.213 | 30.172 |
| Camarilla | 24.179 | 24.499 | 24.820 | 25.140 | 25.460 | 25.781 | 26.101 |
| Woodie | 19.898 | 21.329 | 23.393 | 24.824 | 26.888 | 28.319 | 30.383 |
| Fibonacci | 21.223 | 22.558 | 23.383 | 24.718 | 26.053 | 26.878 | 28.213 |
Numerical data
The following is the status of the technical indicators and moving averages at the time of publication of this technical analysis:
| RSI (14): | 40.71 | |
| MACD (12,26,9): | -0.0330 | |
| Directional Movement: | -14.408 | |
| AROON (14): | -71.428 | |
| DEMA (21): | 24.517 | |
| Parabolic SAR (0,02-0,02-0,2): | 25.000 | |
| Elder Ray (13): | -1.009 | |
| Super Trend (3,10): | 25.171 | |
| Zig ZAG (10): | 23.515 | |
| VORTEX (21): | 0.8960 | |
| Stochastique (14,3,5): | 13.18 | |
| TEMA (21): | 24.054 | |
| Williams %R (14): | -83.54 | |
| Chande Momentum Oscillator (20): | -2.480 | |
| Repulse (5,40,3): | 0.4770 | |
| ROCnROLL: | 2 | |
| TRIX (15,9): | 0.2160 | |
| Courbe Coppock: | 12.07 |
| MA7: | 24.083 | |
| MA20: | 25.006 | |
| MA50: | 23.578 | |
| MA100: | 22.970 | |
| MAexp7: | 23.954 | |
| MAexp20: | 24.372 | |
| MAexp50: | 23.917 | |
| MAexp100: | 23.716 | |
| Price / MA7: | -2.36% | |
| Price / MA20: | -5.96% | |
| Price / MA50: | -0.27% | |
| Price / MA100: | +2.37% | |
| Price / MAexp7: | -1.83% | |
| Price / MAexp20: | -3.52% | |
| Price / MAexp50: | -1.68% | |
| Price / MAexp100: | -0.85% |
News
The latest news and videos published on SOCIETE GENERALE at the time of the analysis were as follows:
- SG Blocks Signs First Licensing Agreement Converting its Residential Construction Vertical to a Royalty Model Reducing Execution Risk and Corporate Overhead Costs
- Société Générale Opts for Axefinance's ACP Solution for Multi-entity Retail Lending Digitalization
- Société Générale Opts for Axefinance's ACP Solution for Multi-entity Retail Lending Digitalization
-
 Alexandre Maymat, head of global transaction and payment services, Société Générale -View from Sibos
- Société Générale : Shares and voting rights as of 31 August 2019
About author

Online


Add a comment
Comments
0 comments on the analysis SOCIETE GENERALE - Daily