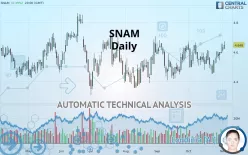
SNAM - Daily - Technical analysis published on 11/05/2019 (GMT)
- 300
- 0
- Who voted?
Click here for a new analysis!
- Timeframe : Daily
- - Analysis generated on
- Status : TARGET REACHED

Summary of the analysis

Additional analysis
Quotes
The SNAM price is 4.648 EUR. The price registered an increase of +0.39% on the session and was traded between 4.617 EUR and 4.673 EUR over the period. The price is currently at +0.67% from its lowest and -0.53% from its highest.The Central Gaps scanner detects a bullish opening marking the presence of buyers ahead of sellers at the opening but not sufficiently marked to allow the price to register a quotation gap.
Bullish opening
Type : Bullish
Timeframe : Openning
Here is a more detailed summary of the historical variations registered by SNAM:
Near a new HIGH record (5 years)
Type : Bullish
Timeframe : Weekly
Near a new HIGH record (1 year)
Type : Bullish
Timeframe : Weekly
Near a new HIGH record (1st january)
Type : Bullish
Timeframe : Weekly
Technical
Technical analysis of this Daily chart of SNAM indicates that the overall trend is strongly bullish. The signals given by the moving averages are 82.14% bullish. This strong bullish trend is confirmed by the strong signals currently being given by short-term moving averages. The Central Indicators market scanner currently does not detect any result that concerns moving averages.
Technical indicators are strongly bullish, suggesting that the price increase should continue.
But beware of excesses. The Central Indicators scanner currently detects this:
CCI indicator is overbought : over 100
Type : Neutral
Timeframe : Daily
Williams %R indicator is overbought : over -20
Type : Neutral
Timeframe : Daily
Pivot points : price is over resistance 1
Type : Neutral
Timeframe : Weekly
Parabolic SAR indicator bullish reversal
Type : Bullish
Timeframe : Daily
Aroon indicator bullish trend
Type : Bullish
Timeframe : Daily
The analysis of the price chart with Central Patterns scanners does not return any result.
There is also a Japanese candlestick pattern detected by Central Candlesticks that could mark the end of the current short-term trend:
White gravestone / inverted hammer
Type : Neutral
Timeframe : Daily
| S3 | S2 | S1 | Price | R1 | R2 | |
|---|---|---|---|---|---|---|
| ProTrendLines | 4.450 | 4.564 | 4.630 | 4.648 | 4.703 | 4.841 |
| Change (%) | -4.26% | -1.81% | -0.39% | - | +1.18% | +4.15% |
| Change | -0.198 | -0.084 | -0.018 | - | +0.055 | +0.193 |
| Level | Major | Major | Intermediate | - | Intermediate | Major |
Pivot points can also be used to set your price objectives. Here is the price situation in relation to pivot points:
| Pivot points | S3 | S2 | S1 | PP | R1 | R2 | R3 |
|---|---|---|---|---|---|---|---|
| Standard | 4.510 | 4.551 | 4.575 | 4.616 | 4.640 | 4.681 | 4.705 |
| Camarilla | 4.582 | 4.588 | 4.594 | 4.600 | 4.606 | 4.612 | 4.618 |
| Woodie | 4.503 | 4.547 | 4.568 | 4.612 | 4.633 | 4.677 | 4.698 |
| Fibonacci | 4.551 | 4.576 | 4.591 | 4.616 | 4.641 | 4.656 | 4.681 |
| Pivot points | S3 | S2 | S1 | PP | R1 | R2 | R3 |
|---|---|---|---|---|---|---|---|
| Standard | 4.369 | 4.410 | 4.482 | 4.523 | 4.595 | 4.636 | 4.708 |
| Camarilla | 4.522 | 4.532 | 4.543 | 4.553 | 4.563 | 4.574 | 4.584 |
| Woodie | 4.384 | 4.418 | 4.497 | 4.531 | 4.610 | 4.644 | 4.723 |
| Fibonacci | 4.410 | 4.454 | 4.480 | 4.523 | 4.567 | 4.593 | 4.636 |
| Pivot points | S3 | S2 | S1 | PP | R1 | R2 | R3 |
|---|---|---|---|---|---|---|---|
| Standard | 4.260 | 4.356 | 4.478 | 4.574 | 4.696 | 4.792 | 4.914 |
| Camarilla | 4.540 | 4.560 | 4.580 | 4.600 | 4.620 | 4.640 | 4.660 |
| Woodie | 4.273 | 4.363 | 4.491 | 4.581 | 4.709 | 4.799 | 4.927 |
| Fibonacci | 4.356 | 4.439 | 4.491 | 4.574 | 4.657 | 4.709 | 4.792 |
Numerical data
The following are the details of the technical indicators and moving averages that were collected to generate this technical analysis:
| RSI (14): | 57.94 | |
| MACD (12,26,9): | 0.0140 | |
| Directional Movement: | 6.949 | |
| AROON (14): | 42.857 | |
| DEMA (21): | 4.579 | |
| Parabolic SAR (0,02-0,02-0,2): | 4.456 | |
| Elder Ray (13): | 0.057 | |
| Super Trend (3,10): | 4.435 | |
| Zig ZAG (10): | 4.630 | |
| VORTEX (21): | 1.0660 | |
| Stochastique (14,3,5): | 83.72 | |
| TEMA (21): | 4.589 | |
| Williams %R (14): | -12.75 | |
| Chande Momentum Oscillator (20): | 0.111 | |
| Repulse (5,40,3): | 0.7760 | |
| ROCnROLL: | 1 | |
| TRIX (15,9): | 0.0130 | |
| Courbe Coppock: | 0.87 |
| MA7: | 4.586 | |
| MA20: | 4.561 | |
| MA50: | 4.553 | |
| MA100: | 4.551 | |
| MAexp7: | 4.588 | |
| MAexp20: | 4.565 | |
| MAexp50: | 4.552 | |
| MAexp100: | 4.532 | |
| Price / MA7: | +1.35% | |
| Price / MA20: | +1.91% | |
| Price / MA50: | +2.09% | |
| Price / MA100: | +2.13% | |
| Price / MAexp7: | +1.31% | |
| Price / MAexp20: | +1.82% | |
| Price / MAexp50: | +2.11% | |
| Price / MAexp100: | +2.56% |
 SNAM
SNAMAbout author

Online


Add a comment
Comments
0 comments on the analysis SNAM - Daily