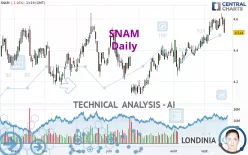
SNAM - Daily - Technical analysis published on 09/19/2024 (GMT)
- 116
- 0
Click here for a new analysis!
- Timeframe : Daily
- - Analysis generated on
- Status : TARGET REACHED

Summary of the analysis

Additional analysis
Quotes
SNAM rating 4.514 EUR. The price is lower by -1.16% since the last closing with the lowest point at 4.511 EUR and the highest point at 4.607 EUR. The deviation from the price is +0.07% for the low point and -2.02% for the high point.Here is a more detailed summary of the historical variations registered by SNAM:
Near a new HIGH record (1 year)
Type : Bullish
Timeframe : Weekly
Near a new HIGH record (1st january)
Type : Bullish
Timeframe : Weekly
Near a new LOW record (1 month)
Type : Bearish
Timeframe : Weekly
Technical
Technical analysis of SNAM in Daily shows an overall bullish trend. 78.57% of the signals given by moving averages are bullish. Caution: the neutral signals currently given by the short-term moving averages indicate that this bullish trend is showing signs of running out of steam. The Central Indicators scanner detects a bearish signal on moving averages that could impact this trend:
Bearish price crossover with adaptative moving average 20
Type : Bearish
Timeframe : Daily
The probability of a further increase is slight given the direction of the technical indicators.
Central Indicators, the scanner specialised in technical indicators, has identified these signals:
Pivot points : price is under support 1
Type : Neutral
Timeframe : Weekly
Pivot points : price is under support 3
Type : Neutral
Timeframe : Daily
Central Patterns, the scanner specializing in chart patterns, did not identify any signals.
The Central Candlesticks scanner, specialised in Japanese candlesticks, did not identify any signals.
| S3 | S2 | S1 | Price | R1 | R2 | |
|---|---|---|---|---|---|---|
| ProTrendLines | 4.274 | 4.352 | 4.466 | 4.514 | 4.584 | 4.884 |
| Change (%) | -5.32% | -3.59% | -1.06% | - | +1.55% | +8.20% |
| Change | -0.240 | -0.162 | -0.048 | - | +0.070 | +0.370 |
| Level | Intermediate | Major | Minor | - | Major | Major |
To determine price objectives, it is also possible to use the pivot points. Here is the price position in relation to pivot points:
| Pivot points | S3 | S2 | S1 | PP | R1 | R2 | R3 |
|---|---|---|---|---|---|---|---|
| Standard | 4.488 | 4.522 | 4.545 | 4.579 | 4.602 | 4.636 | 4.659 |
| Camarilla | 4.551 | 4.557 | 4.562 | 4.567 | 4.572 | 4.578 | 4.583 |
| Woodie | 4.482 | 4.519 | 4.539 | 4.576 | 4.596 | 4.633 | 4.653 |
| Fibonacci | 4.522 | 4.544 | 4.558 | 4.579 | 4.601 | 4.615 | 4.636 |
| Pivot points | S3 | S2 | S1 | PP | R1 | R2 | R3 |
|---|---|---|---|---|---|---|---|
| Standard | 4.452 | 4.491 | 4.527 | 4.566 | 4.602 | 4.641 | 4.677 |
| Camarilla | 4.542 | 4.549 | 4.556 | 4.563 | 4.570 | 4.577 | 4.584 |
| Woodie | 4.451 | 4.490 | 4.526 | 4.565 | 4.601 | 4.640 | 4.676 |
| Fibonacci | 4.491 | 4.520 | 4.537 | 4.566 | 4.595 | 4.612 | 4.641 |
| Pivot points | S3 | S2 | S1 | PP | R1 | R2 | R3 |
|---|---|---|---|---|---|---|---|
| Standard | 4.056 | 4.146 | 4.315 | 4.405 | 4.574 | 4.664 | 4.833 |
| Camarilla | 4.412 | 4.436 | 4.459 | 4.483 | 4.507 | 4.531 | 4.554 |
| Woodie | 4.095 | 4.166 | 4.354 | 4.425 | 4.613 | 4.684 | 4.872 |
| Fibonacci | 4.146 | 4.245 | 4.306 | 4.405 | 4.504 | 4.565 | 4.664 |
Numerical data
The following is the status of the technical indicators and moving averages at the time of publication of this technical analysis:
| RSI (14): | 56.19 | |
| MACD (12,26,9): | 0.0500 | |
| Directional Movement: | 4.224 | |
| AROON (14): | 85.714 | |
| DEMA (21): | 4.588 | |
| Parabolic SAR (0,02-0,02-0,2): | 4.634 | |
| Elder Ray (13): | 0.015 | |
| Super Trend (3,10): | 4.453 | |
| Zig ZAG (10): | 4.538 | |
| VORTEX (21): | 1.1040 | |
| Stochastique (14,3,5): | 67.46 | |
| TEMA (21): | 4.595 | |
| Williams %R (14): | -50.00 | |
| Chande Momentum Oscillator (20): | 0.056 | |
| Repulse (5,40,3): | -2.1550 | |
| ROCnROLL: | -1 | |
| TRIX (15,9): | 0.1710 | |
| Courbe Coppock: | 5.51 |
| MA7: | 4.567 | |
| MA20: | 4.516 | |
| MA50: | 4.425 | |
| MA100: | 4.312 | |
| MAexp7: | 4.561 | |
| MAexp20: | 4.520 | |
| MAexp50: | 4.432 | |
| MAexp100: | 4.356 | |
| Price / MA7: | -1.16% | |
| Price / MA20: | -0.04% | |
| Price / MA50: | +2.01% | |
| Price / MA100: | +4.68% | |
| Price / MAexp7: | -1.03% | |
| Price / MAexp20: | -0.13% | |
| Price / MAexp50: | +1.85% | |
| Price / MAexp100: | +3.63% |
About author
Online


Add a comment
Comments
0 comments on the analysis SNAM - Daily