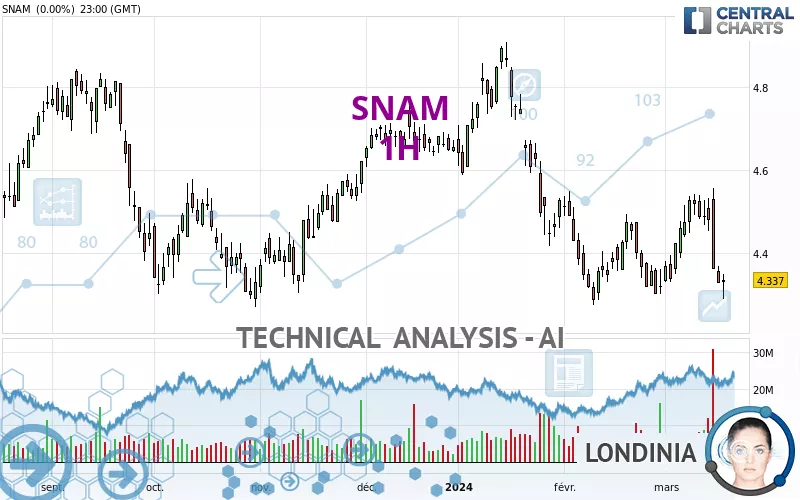
SNAM - 1H - Technical analysis published on 03/20/2024 (GMT)
- 135
- 0
- Timeframe : 1H
- - Analysis generated on
- Status : NEUTRAL

Summary of the analysis

Additional analysis
Quotes
The SNAM price is 4.380 EUR. The price has increased by +0.99% since the last closing and was between 4.343 EUR and 4.405 EUR. This implies that the price is at +0.85% from its lowest and at -0.57% from its highest.The Central Gaps scanner detects a bullish opening. A small advantage for buyers in the very short term.
Bullish opening
Type : Bullish
Timeframe : Openning
So that you have an overall view of the price change, here is a table showing the variations over several periods:
Near a new LOW record (1 year)
Type : Bearish
Timeframe : Weekly
Near a new LOW record (1st january)
Type : Bearish
Timeframe : Weekly
Near a new HIGH record (1 month)
Type : Bullish
Timeframe : Weekly
The Central Volumes scanner detects abnormal volumes on the asset:
Abnormal volumes
Timeframe : 5 days
Technical
Technical analysis of this 1H chart of SNAM indicates that the overall trend is slightly bearish. 60.71% of the signals given by moving averages are bullish. As the signals currently given by short-term moving averages are rather neutral, the overall trend could quickly return to neutral as well. The Central Indicators market scanner currently does not detect any result that concerns moving averages.
In fact, 12 technical indicators on 18 studied are currently positioned bullish. But beware of excesses. The Central Indicators scanner currently detects this:
CCI indicator is overbought : over 100
Type : Neutral
Timeframe : 1 hour
CCI indicator: bearish divergence
Type : Bearish
Timeframe : 1 hour
Pivot points : price is over resistance 1
Type : Neutral
Timeframe : 1 hour
RSI indicator is back over 50
Type : Bullish
Timeframe : 1 hour
Central Patterns, the market scanner focusing on chart patterns, resistances and supports found these results:
Near horizontal resistance
Type : Bearish
Timeframe : 1 hour
Resistance of channel is broken
Type : Bullish
Timeframe : 1 hour
Central Candlesticks, the scanner specialised in Japanese candlesticks, detects a bearish signal that could support the hypothesis of a small drop in the very short term:
Bearish harami cross
Type : Bearish
Timeframe : 1 hour
| S3 | S2 | S1 | Price | R1 | R2 | R3 | |
|---|---|---|---|---|---|---|---|
| ProTrendLines | 4.304 | 4.333 | 4.365 | 4.380 | 4.404 | 4.455 | 4.494 |
| Change (%) | -1.74% | -1.07% | -0.34% | - | +0.55% | +1.71% | +2.60% |
| Change | -0.076 | -0.047 | -0.015 | - | +0.024 | +0.075 | +0.114 |
| Level | Major | Minor | Minor | - | Minor | Intermediate | Minor |
Attention could also be paid to pivot points to set price objectives:
| Pivot points | S3 | S2 | S1 | PP | R1 | R2 | R3 |
|---|---|---|---|---|---|---|---|
| Standard | 4.243 | 4.267 | 4.302 | 4.326 | 4.361 | 4.385 | 4.420 |
| Camarilla | 4.321 | 4.326 | 4.332 | 4.337 | 4.342 | 4.348 | 4.353 |
| Woodie | 4.249 | 4.270 | 4.308 | 4.329 | 4.367 | 4.388 | 4.426 |
| Fibonacci | 4.267 | 4.290 | 4.304 | 4.326 | 4.349 | 4.363 | 4.385 |
| Pivot points | S3 | S2 | S1 | PP | R1 | R2 | R3 |
|---|---|---|---|---|---|---|---|
| Standard | 4.103 | 4.233 | 4.297 | 4.427 | 4.491 | 4.621 | 4.685 |
| Camarilla | 4.309 | 4.326 | 4.344 | 4.362 | 4.380 | 4.398 | 4.415 |
| Woodie | 4.071 | 4.217 | 4.265 | 4.411 | 4.459 | 4.605 | 4.653 |
| Fibonacci | 4.233 | 4.307 | 4.353 | 4.427 | 4.501 | 4.547 | 4.621 |
| Pivot points | S3 | S2 | S1 | PP | R1 | R2 | R3 |
|---|---|---|---|---|---|---|---|
| Standard | 3.940 | 4.108 | 4.214 | 4.382 | 4.488 | 4.656 | 4.762 |
| Camarilla | 4.246 | 4.271 | 4.296 | 4.321 | 4.346 | 4.371 | 4.396 |
| Woodie | 3.910 | 4.093 | 4.184 | 4.367 | 4.458 | 4.641 | 4.732 |
| Fibonacci | 4.108 | 4.212 | 4.277 | 4.382 | 4.486 | 4.551 | 4.656 |
Numerical data
The following are the details of the technical indicators and moving averages that were collected to generate this technical analysis:
| RSI (14): | 52.77 | |
| MACD (12,26,9): | -0.0080 | |
| Directional Movement: | 4.995 | |
| AROON (14): | 64.286 | |
| DEMA (21): | 4.344 | |
| Parabolic SAR (0,02-0,02-0,2): | 4.338 | |
| Elder Ray (13): | 0.014 | |
| Super Trend (3,10): | 4.292 | |
| Zig ZAG (10): | 4.385 | |
| VORTEX (21): | 1.0400 | |
| Stochastique (14,3,5): | 73.39 | |
| TEMA (21): | 4.361 | |
| Williams %R (14): | -21.05 | |
| Chande Momentum Oscillator (20): | 0.076 | |
| Repulse (5,40,3): | 0.4410 | |
| ROCnROLL: | -1 | |
| TRIX (15,9): | -0.0710 | |
| Courbe Coppock: | 1.46 |
| MA7: | 4.410 | |
| MA20: | 4.403 | |
| MA50: | 4.464 | |
| MA100: | 4.464 | |
| MAexp7: | 4.370 | |
| MAexp20: | 4.362 | |
| MAexp50: | 4.394 | |
| MAexp100: | 4.413 | |
| Price / MA7: | -0.68% | |
| Price / MA20: | -0.52% | |
| Price / MA50: | -1.88% | |
| Price / MA100: | -1.88% | |
| Price / MAexp7: | +0.23% | |
| Price / MAexp20: | +0.41% | |
| Price / MAexp50: | -0.32% | |
| Price / MAexp100: | -0.75% |
About author
Online


Add a comment
Comments
0 comments on the analysis SNAM - 1H