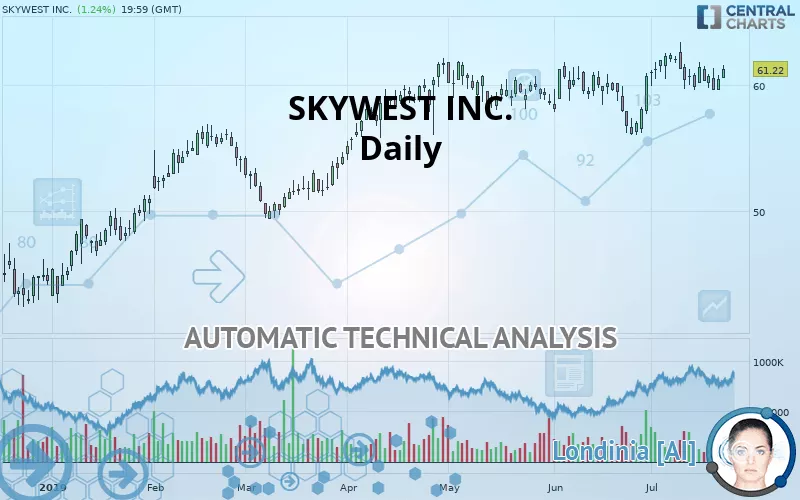
SKYWEST INC. - Daily - Technical analysis published on 07/24/2019 (GMT)
- 286
- 0
- Who voted?
Click here for a new analysis!
- Timeframe : Daily
- - Analysis generated on
- Status : INVALID

Summary of the analysis

Additional analysis
Quotes
The SKYWEST INC. price is 61.22 USD. The price registered an increase of +1.24% on the session and was traded between 60.56 USD and 61.56 USD over the period. The price is currently at +1.09% from its lowest and -0.55% from its highest.A bullish opening was detected by the Central Gaps scanner. Buyers are trying to impose a bullish momentum in the very short term.
Bullish opening
Type : Bullish
Timeframe : Openning
Here is a more detailed summary of the historical variations registered by SKYWEST INC.:
Near a new HIGH record (1st january)
Type : Bullish
Timeframe : Weekly
Near a new HIGH record (1 month)
Type : Bullish
Timeframe : Weekly
Technical
Technical analysis of SKYWEST INC. in Daily shows a strongly overall bullish trend. 92.86% of the signals given by moving averages are bullish. This strongly bullish trend is supported by the strong bullish signals given by short-term moving averages. The Central Indicators market scanner is currently detecting several bullish signals that could impact this trend:
Bullish price crossover with Moving Average 20
Type : Bullish
Timeframe : Daily
Bullish price crossover with Moving Average 50
Type : Bullish
Timeframe : Daily
Bullish price crossover with adaptative moving average 20
Type : Bullish
Timeframe : Daily
On the 18 technical indicators analysed, 6 are bullish, 7 are neutral and 5 are bearish. Caution: the Central Indicators scanner currently detects an excess:
MACD indicator: bullish divergence
Type : Bullish
Timeframe : Daily
Williams %R indicator is overbought : over -20
Type : Neutral
Timeframe : Daily
Pivot points : price is over resistance 1
Type : Neutral
Timeframe : Daily
Pivot points : price is over resistance 1
Type : Neutral
Timeframe : Weekly
RSI indicator is back over 50
Type : Bullish
Timeframe : Daily
Ichimoku : price is over the cloud
Type : Bullish
Timeframe : Daily
Price is back under the pivot point
Type : Bearish
Timeframe : Weekly
An analysis of the price chart with the Central Patterns scanner (detector of chart patterns and resistances and supports) shows a result that can have an impact on the price change:
Support of channel is broken
Type : Bearish
Timeframe : Daily
For a small rebound in the very short term, the Central Candlesticks scanner currently notes the presence of this bullish pattern in Japanese candlesticks:
Bullish harami
Type : Bullish
Timeframe : Daily
| S3 | S2 | S1 | Price | R1 | |
|---|---|---|---|---|---|
| ProTrendLines | 49.75 | 56.16 | 60.30 | 61.22 | 65.30 |
| Change (%) | -18.74% | -8.27% | -1.50% | - | +6.66% |
| Change | -11.47 | -5.06 | -0.92 | - | +4.08 |
| Level | Minor | Major | Major | - | Major |
Attention could also be paid to pivot points to set price objectives:
| Pivot points | S3 | S2 | S1 | PP | R1 | R2 | R3 |
|---|---|---|---|---|---|---|---|
| Standard | 58.60 | 59.09 | 59.78 | 60.27 | 60.96 | 61.45 | 62.14 |
| Camarilla | 60.15 | 60.25 | 60.36 | 60.47 | 60.58 | 60.69 | 60.80 |
| Woodie | 58.70 | 59.14 | 59.88 | 60.32 | 61.06 | 61.50 | 62.24 |
| Fibonacci | 59.09 | 59.54 | 59.82 | 60.27 | 60.72 | 61.00 | 61.45 |
| Pivot points | S3 | S2 | S1 | PP | R1 | R2 | R3 |
|---|---|---|---|---|---|---|---|
| Standard | 56.62 | 58.10 | 58.83 | 60.31 | 61.04 | 62.52 | 63.25 |
| Camarilla | 58.96 | 59.17 | 59.37 | 59.57 | 59.77 | 59.98 | 60.18 |
| Woodie | 56.26 | 57.91 | 58.47 | 60.12 | 60.68 | 62.33 | 62.89 |
| Fibonacci | 58.10 | 58.94 | 59.46 | 60.31 | 61.15 | 61.67 | 62.52 |
| Pivot points | S3 | S2 | S1 | PP | R1 | R2 | R3 |
|---|---|---|---|---|---|---|---|
| Standard | 51.38 | 53.69 | 57.18 | 59.49 | 62.98 | 65.29 | 68.78 |
| Camarilla | 59.08 | 59.61 | 60.14 | 60.67 | 61.20 | 61.73 | 62.27 |
| Woodie | 51.97 | 53.99 | 57.77 | 59.79 | 63.57 | 65.59 | 69.37 |
| Fibonacci | 53.69 | 55.91 | 57.27 | 59.49 | 61.71 | 63.07 | 65.29 |
Numerical data
The following is the status of technical indicators and moving averages registered at the time this technical analysis was created:
| RSI (14): | 54.26 | |
| MACD (12,26,9): | 0.2700 | |
| Directional Movement: | 6.10 | |
| AROON (14): | -50.00 | |
| DEMA (21): | 60.84 | |
| Parabolic SAR (0,02-0,02-0,2): | 62.83 | |
| Elder Ray (13): | 0.46 | |
| Super Trend (3,10): | 57.77 | |
| Zig ZAG (10): | 61.22 | |
| VORTEX (21): | 1.0700 | |
| Stochastique (14,3,5): | 22.19 | |
| TEMA (21): | 60.84 | |
| Williams %R (14): | -56.92 | |
| Chande Momentum Oscillator (20): | -1.09 | |
| Repulse (5,40,3): | 0.8700 | |
| ROCnROLL: | 1 | |
| TRIX (15,9): | 0.0800 | |
| Courbe Coppock: | 1.97 |
| MA7: | 60.50 | |
| MA20: | 60.43 | |
| MA50: | 59.86 | |
| MA100: | 57.96 | |
| MAexp7: | 60.64 | |
| MAexp20: | 60.46 | |
| MAexp50: | 59.75 | |
| MAexp100: | 58.30 | |
| Price / MA7: | +1.19% | |
| Price / MA20: | +1.31% | |
| Price / MA50: | +2.27% | |
| Price / MA100: | +5.62% | |
| Price / MAexp7: | +0.96% | |
| Price / MAexp20: | +1.26% | |
| Price / MAexp50: | +2.46% | |
| Price / MAexp100: | +5.01% |
News
The latest news and videos published on SKYWEST INC. at the time of the analysis were as follows:
- SkyWest, Inc. Announces Second Quarter 2019 Results Call Date
- SkyWest, Inc. Reports June 2019 Traffic
- SkyWest, Inc. Reports May 2019 Traffic
- SkyWest, Inc. Announces Quarterly Dividend of $.12 per Share
- SkyWest, Inc. Reports April 2019 Traffic
About author

Online


Add a comment
Comments
0 comments on the analysis SKYWEST INC. - Daily