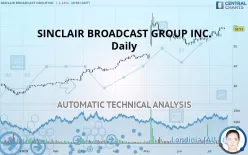
SINCLAIR INC. - Daily - Technical analysis published on 07/17/2019 (GMT)
- 341
- 0
- Who voted?
Click here for a new analysis!
- Timeframe : Daily
- - Analysis generated on
- Status : INVALID

Summary of the analysis

Additional analysis
Quotes
SINCLAIR BROADCAST GROUP INC. rating 58.53 USD. The price registered a decrease of -1.13% on the session with the lowest point at 58.39 USD and the highest point at 59.38 USD. The deviation from the price is +0.24% for the low point and -1.43% for the high point.A bearish opening was detected by the Central Gaps scanner. Sellers are trying to impose a bearish trend in the very short term.
Bearish opening
Type : Bearish
Timeframe : Openning
Here is a more detailed summary of the historical variations registered by SINCLAIR BROADCAST GROUP INC.:
Near a new HIGH record (1 month)
Type : Bullish
Timeframe : Weekly
Technical
Technical analysis of SINCLAIR BROADCAST GROUP INC. in Daily shows a strongly overall bullish trend. The signals given by moving averages are 85.71% bullish. This strongly bullish trend seems to be running out of steam given the signals being given by short-term moving averages. The Central Indicators market scanner is currently detecting a bullish signal that could impact this trend:
Moving Average bullish crossovers : MA20 & MA50
Type : Bullish
Timeframe : Daily
The probability of a further increase is high given the direction of the technical indicators.
Caution: the Central Indicators scanner currently detects an excess:
CCI indicator is overbought : over 100
Type : Neutral
Timeframe : Daily
Williams %R indicator is overbought : over -20
Type : Neutral
Timeframe : Daily
Pivot points : price is under support 1
Type : Neutral
Timeframe : Daily
Price is back over the pivot point
Type : Bullish
Timeframe : Weekly
The Central Patterns scanner, which studies chart patterns, resistances and supports, has identified this signal:
Near resistance of channel
Type : Bearish
Timeframe : Daily
The Central Candlesticks scanner which studies Japanese candlesticks did not detect anything.
| S3 | S2 | S1 | Price | R1 | |
|---|---|---|---|---|---|
| ProTrendLines | 33.09 | 42.90 | 50.89 | 58.53 | 61.81 |
| Change (%) | -43.46% | -26.70% | -13.05% | - | +5.60% |
| Change | -25.44 | -15.63 | -7.64 | - | +3.28 |
| Level | Intermediate | Major | Major | - | Major |
Attention could also be paid to pivot points to set price objectives:
| Pivot points | S3 | S2 | S1 | PP | R1 | R2 | R3 |
|---|---|---|---|---|---|---|---|
| Standard | 57.81 | 58.16 | 58.68 | 59.03 | 59.55 | 59.90 | 60.42 |
| Camarilla | 58.96 | 59.04 | 59.12 | 59.20 | 59.28 | 59.36 | 59.44 |
| Woodie | 57.90 | 58.20 | 58.77 | 59.07 | 59.64 | 59.94 | 60.51 |
| Fibonacci | 58.16 | 58.49 | 58.70 | 59.03 | 59.36 | 59.57 | 59.90 |
| Pivot points | S3 | S2 | S1 | PP | R1 | R2 | R3 |
|---|---|---|---|---|---|---|---|
| Standard | 51.44 | 53.18 | 56.11 | 57.85 | 60.78 | 62.52 | 65.45 |
| Camarilla | 57.77 | 58.19 | 58.62 | 59.05 | 59.48 | 59.91 | 60.33 |
| Woodie | 52.05 | 53.48 | 56.72 | 58.15 | 61.39 | 62.82 | 66.06 |
| Fibonacci | 53.18 | 54.96 | 56.06 | 57.85 | 59.63 | 60.73 | 62.52 |
| Pivot points | S3 | S2 | S1 | PP | R1 | R2 | R3 |
|---|---|---|---|---|---|---|---|
| Standard | 44.93 | 47.58 | 50.60 | 53.25 | 56.27 | 58.92 | 61.94 |
| Camarilla | 52.07 | 52.59 | 53.11 | 53.63 | 54.15 | 54.67 | 55.19 |
| Woodie | 45.13 | 47.67 | 50.80 | 53.34 | 56.47 | 59.01 | 62.14 |
| Fibonacci | 47.58 | 49.74 | 51.08 | 53.25 | 55.41 | 56.75 | 58.92 |
Numerical data
The following are the details of the technical indicators and moving averages that were collected to generate this technical analysis:
| RSI (14): | 64.41 | |
| MACD (12,26,9): | 1.5000 | |
| Directional Movement: | 16.70 | |
| AROON (14): | 64.28 | |
| DEMA (21): | 57.86 | |
| Parabolic SAR (0,02-0,02-0,2): | 55.06 | |
| Elder Ray (13): | 1.98 | |
| Super Trend (3,10): | 54.22 | |
| Zig ZAG (10): | 58.53 | |
| VORTEX (21): | 1.1900 | |
| Stochastique (14,3,5): | 91.38 | |
| TEMA (21): | 58.48 | |
| Williams %R (14): | -13.85 | |
| Chande Momentum Oscillator (20): | 5.33 | |
| Repulse (5,40,3): | 0.3800 | |
| ROCnROLL: | 1 | |
| TRIX (15,9): | 0.2600 | |
| Courbe Coppock: | 17.08 |
| MA7: | 57.74 | |
| MA20: | 55.45 | |
| MA50: | 55.45 | |
| MA100: | 47.88 | |
| MAexp7: | 57.94 | |
| MAexp20: | 56.09 | |
| MAexp50: | 53.39 | |
| MAexp100: | 48.66 | |
| Price / MA7: | +1.37% | |
| Price / MA20: | +5.55% | |
| Price / MA50: | +5.55% | |
| Price / MA100: | +22.24% | |
| Price / MAexp7: | +1.02% | |
| Price / MAexp20: | +4.35% | |
| Price / MAexp50: | +9.63% | |
| Price / MAexp100: | +20.28% |
News
The latest news and videos published on SINCLAIR BROADCAST GROUP INC. at the time of the analysis were as follows:
- Sinclair Promotes Richard Cook to General Manager In Pittsburgh, PA
- Sinclair Reports Preliminary Second Quarter 2019 Media Revenue
- Sinclair Announces Private Offering of Senior Secured Notes and Senior Notes of Diamond Sports Group
- Sinclair Broadcast Group's CompulseOTT Unit Releases New OTT Reporting Platform: "Compulse360"
- Sinclair Promotes Brian Dodge To General Manager In South Bend, IN
About author

Online


Add a comment
Comments
0 comments on the analysis SINCLAIR INC. - Daily