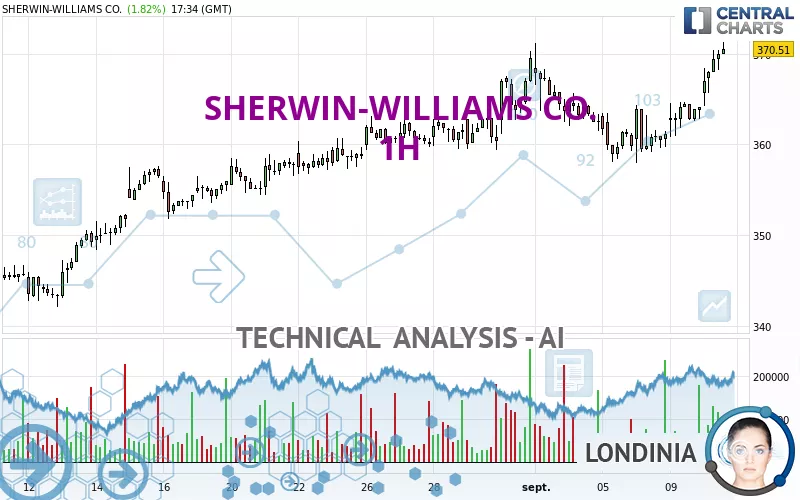
SHERWIN-WILLIAMS CO. - 1H - Technical analysis published on 09/10/2024 (GMT)
- 159
- 0
Click here for a new analysis!
- Timeframe : 1H
- - Analysis generated on
- Status : INVALID

Summary of the analysis

Additional analysis
Quotes
SHERWIN-WILLIAMS CO. rating 370.51 USD. On the day, this instrument gained +1.82% with the lowest point at 364.17 USD and the highest point at 371.28 USD. The deviation from the price is +1.74% for the low point and -0.21% for the high point.A study of price movements over other periods shows the following variations:
Near a new HIGH record (5 years)
Type : Bullish
Timeframe : Weekly
Near a new HIGH record (1 year)
Type : Bullish
Timeframe : Weekly
Near a new HIGH record (1st january)
Type : Bullish
Timeframe : Weekly
Near a new HIGH record (1 month)
Type : Bullish
Timeframe : Weekly
Technical
Technical analysis of this 1H chart of SHERWIN-WILLIAMS CO. indicates that the overall trend is strongly bullish. The signals given by the moving averages are 89.29% bullish. This strong bullish trend is confirmed by the strong signals currently being given by short-term moving averages. The Central Indicators market scanner currently does not detect any result that concerns moving averages.
In fact, 16 technical indicators on 18 studied are currently positioned bullish. Central Indicators, the detector scanner for these technical indicators has recently detected several signals:
Pivot points : price is over resistance 1
Type : Neutral
Timeframe : Weekly
Pivot points : price is over resistance 3
Type : Neutral
Timeframe : 1 hour
Central Patterns, the market scanner focusing on chart patterns, resistances and supports found these results:
Near horizontal resistance
Type : Bearish
Timeframe : 1 hour
Resistance of channel is broken
Type : Bullish
Timeframe : 1 hour
The Central Candlesticks scanner, specialised in Japanese candlesticks, did not identify any signals.
| S3 | S2 | S1 | Price | |
|---|---|---|---|---|
| ProTrendLines | 344.64 | 362.99 | 369.37 | 370.51 |
| Change (%) | -6.98% | -2.03% | -0.31% | - |
| Change | -25.87 | -7.52 | -1.14 | - |
| Level | Major | Major | Major | - |
Attention could also be paid to pivot points to set price objectives:
| Pivot points | S3 | S2 | S1 | PP | R1 | R2 | R3 |
|---|---|---|---|---|---|---|---|
| Standard | 357.74 | 359.29 | 361.60 | 363.15 | 365.46 | 367.01 | 369.32 |
| Camarilla | 362.84 | 363.19 | 363.55 | 363.90 | 364.25 | 364.61 | 364.96 |
| Woodie | 358.11 | 359.48 | 361.97 | 363.34 | 365.83 | 367.20 | 369.69 |
| Fibonacci | 359.29 | 360.77 | 361.68 | 363.15 | 364.63 | 365.54 | 367.01 |
| Pivot points | S3 | S2 | S1 | PP | R1 | R2 | R3 |
|---|---|---|---|---|---|---|---|
| Standard | 342.15 | 350.03 | 355.43 | 363.31 | 368.71 | 376.59 | 381.99 |
| Camarilla | 357.18 | 358.40 | 359.61 | 360.83 | 362.05 | 363.27 | 364.48 |
| Woodie | 340.91 | 349.41 | 354.19 | 362.69 | 367.47 | 375.97 | 380.75 |
| Fibonacci | 350.03 | 355.10 | 358.24 | 363.31 | 368.38 | 371.52 | 376.59 |
| Pivot points | S3 | S2 | S1 | PP | R1 | R2 | R3 |
|---|---|---|---|---|---|---|---|
| Standard | 311.62 | 323.53 | 346.45 | 358.36 | 381.28 | 393.19 | 416.11 |
| Camarilla | 359.79 | 362.99 | 366.18 | 369.37 | 372.56 | 375.76 | 378.95 |
| Woodie | 317.13 | 326.28 | 351.96 | 361.11 | 386.79 | 395.94 | 421.62 |
| Fibonacci | 323.53 | 336.84 | 345.06 | 358.36 | 371.67 | 379.89 | 393.19 |
Numerical data
The following is the status of technical indicators and moving averages registered at the time this technical analysis was created:
| RSI (14): | 70.52 | |
| MACD (12,26,9): | 1.8300 | |
| Directional Movement: | 22.40 | |
| AROON (14): | 92.86 | |
| DEMA (21): | 367.07 | |
| Parabolic SAR (0,02-0,02-0,2): | 364.26 | |
| Elder Ray (13): | 4.36 | |
| Super Trend (3,10): | 363.86 | |
| Zig ZAG (10): | 370.43 | |
| VORTEX (21): | 1.2000 | |
| Stochastique (14,3,5): | 93.43 | |
| TEMA (21): | 368.76 | |
| Williams %R (14): | -6.79 | |
| Chande Momentum Oscillator (20): | 9.36 | |
| Repulse (5,40,3): | 0.7100 | |
| ROCnROLL: | 1 | |
| TRIX (15,9): | 0.0300 | |
| Courbe Coppock: | 3.75 |
| MA7: | 364.44 | |
| MA20: | 359.49 | |
| MA50: | 340.12 | |
| MA100: | 322.25 | |
| MAexp7: | 367.99 | |
| MAexp20: | 365.15 | |
| MAexp50: | 363.42 | |
| MAexp100: | 360.85 | |
| Price / MA7: | +1.67% | |
| Price / MA20: | +3.07% | |
| Price / MA50: | +8.94% | |
| Price / MA100: | +14.98% | |
| Price / MAexp7: | +0.68% | |
| Price / MAexp20: | +1.47% | |
| Price / MAexp50: | +1.95% | |
| Price / MAexp100: | +2.68% |
News
The last news published on SHERWIN-WILLIAMS CO. at the time of the generation of this analysis was as follows:
- Sherwin-Williams to Hold Financial Community Presentation on August 29, 2024
- Sherwin-Williams Bolsters Presence in Asia with Key Showcase at China Coatings Show 2024
- HGTV Home® by Sherwin-Williams Announces Timeless and Serene "Naturally Refined" as 2025 Color Collection of the Year
- HGTV Home® by Sherwin-Williams Announces Cabinet & Furniture, a New Interior Paint That Helps Take Creative Visions Further
- The Sherwin-Williams Company Reports 2024 Second Quarter Financial Results
About author
Online


Add a comment
Comments
0 comments on the analysis SHERWIN-WILLIAMS CO. - 1H