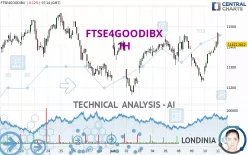
FTSE4GOODIBX - 1H - Technical analysis published on 07/11/2024 (GMT)
- 109
- 0
Click here for a new analysis!
- Timeframe : 1H
- - Analysis generated on
- Status : TARGET REACHED
Summary of the analysis

Additional analysis
Quotes
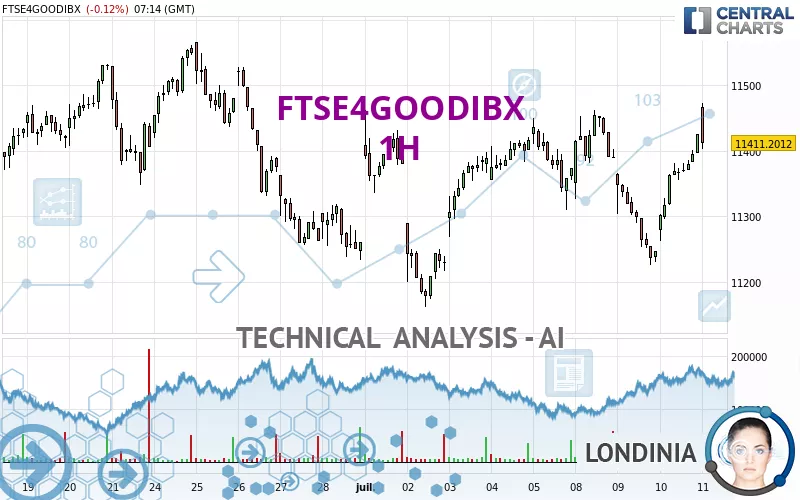
The FTSE4GOODIBX rating is 11,420.5996 EUR. On the day, this instrument lost -0.04% and was between 11,419.0000 EUR and 11,474.0996 EUR. This implies that the price is at +0.01% from its lowest and at -0.47% from its highest.A bullish opening was detected by the Central Gaps scanner. Buyers are trying to impose a bullish momentum in the very short term.
Bullish opening
Type : Bullish
Timeframe : Openning
A study of price movements over other periods shows the following variations:
Near a new HIGH record (5 years)
Type : Bullish
Timeframe : Weekly
Near a new HIGH record (1 year)
Type : Bullish
Timeframe : Weekly
Near a new HIGH record (1st january)
Type : Bullish
Timeframe : Weekly
Near a new HIGH record (1 month)
Type : Bullish
Timeframe : Weekly
Technical
Technical analysis of FTSE4GOODIBX in 1H shows an overall slightly bullish trend. 60.71% of the signals given by moving averages are bullish. The slightly bullish signals given by short-term moving averages do not show a strengthening of this global trend. There is no crossing of moving average by the price or crossing of moving averages between themselves.
In fact, according to the parameters integrated into the Central Analyzer system, 15 technical indicators out of 18 analysed are currently bullish. Caution: the Central Indicators scanner currently detects an excess:
CCI indicator is overbought : over 100
Type : Neutral
Timeframe : 1 hour
Williams %R indicator is overbought : over -20
Type : Neutral
Timeframe : 1 hour
Pivot points : price is over resistance 2
Type : Neutral
Timeframe : 1 hour
Central Patterns, the scanner specializing in chart patterns, did not identify any signals.
No result was found by the Central Candlesticks scanner on Japanese candlesticks.
| S3 | S2 | S1 | Price | R1 | R2 | R3 | |
|---|---|---|---|---|---|---|---|
| ProTrendLines | 11,228.2330 | 11,323.4000 | 11,405.7290 | 11,420.5996 | 11,462.0000 | 11,565.1200 | 11,658.7000 |
| Change (%) | -1.68% | -0.85% | -0.13% | - | +0.36% | +1.27% | +2.08% |
| Change | -192.3666 | -97.1996 | -14.8706 | - | +41.4004 | +144.5204 | +238.1004 |
| Level | Intermediate | Major | Minor | - | Major | Intermediate | Minor |
Attention could also be paid to pivot points to set price objectives:
| Pivot points | S3 | S2 | S1 | PP | R1 | R2 | R3 |
|---|---|---|---|---|---|---|---|
| Standard | 11,154.3991 | 11,208.4993 | 11,316.6999 | 11,370.8001 | 11,479.0007 | 11,533.1009 | 11,641.3015 |
| Camarilla | 11,380.2677 | 11,395.1453 | 11,410.0228 | 11,424.9004 | 11,439.7780 | 11,454.6556 | 11,469.5331 |
| Woodie | 11,181.4492 | 11,222.0244 | 11,343.7500 | 11,384.3252 | 11,506.0508 | 11,546.6260 | 11,668.3516 |
| Fibonacci | 11,208.4993 | 11,270.4982 | 11,308.8012 | 11,370.8001 | 11,432.7990 | 11,471.1020 | 11,533.1009 |
| Pivot points | S3 | S2 | S1 | PP | R1 | R2 | R3 |
|---|---|---|---|---|---|---|---|
| Standard | 10,898.7656 | 11,029.9326 | 11,201.5664 | 11,332.7334 | 11,504.3672 | 11,635.5342 | 11,807.1680 |
| Camarilla | 11,289.9300 | 11,317.6867 | 11,345.4435 | 11,373.2002 | 11,400.9569 | 11,428.7137 | 11,456.4704 |
| Woodie | 10,918.9990 | 11,040.0493 | 11,221.7998 | 11,342.8501 | 11,524.6006 | 11,645.6509 | 11,827.4014 |
| Fibonacci | 11,029.9326 | 11,145.6025 | 11,217.0635 | 11,332.7334 | 11,448.4033 | 11,519.8643 | 11,635.5342 |
| Pivot points | S3 | S2 | S1 | PP | R1 | R2 | R3 |
|---|---|---|---|---|---|---|---|
| Standard | 10,343.6653 | 10,787.6325 | 11,023.9661 | 11,467.9333 | 11,704.2669 | 12,148.2341 | 12,384.5677 |
| Camarilla | 11,073.2171 | 11,135.5780 | 11,197.9389 | 11,260.2998 | 11,322.6607 | 11,385.0216 | 11,447.3825 |
| Woodie | 10,239.8486 | 10,735.7241 | 10,920.1494 | 11,416.0249 | 11,600.4502 | 12,096.3257 | 12,280.7510 |
| Fibonacci | 10,787.6325 | 11,047.5074 | 11,208.0584 | 11,467.9333 | 11,727.8082 | 11,888.3592 | 12,148.2341 |
Numerical data
The following are the details of the technical indicators and moving averages that were collected to generate this technical analysis:
| RSI (14): | 64.37 | |
| MACD (12,26,9): | 6.9484 | |
| Directional Movement: | 13.6248 | |
| AROON (14): | 71.4286 | |
| DEMA (21): | 11,358.0508 | |
| Parabolic SAR (0,02-0,02-0,2): | 11,274.0799 | |
| Elder Ray (13): | 50.6197 | |
| Super Trend (3,10): | 11,325.8700 | |
| Zig ZAG (10): | 11,424.9004 | |
| VORTEX (21): | 0.9336 | |
| Stochastique (14,3,5): | 97.44 | |
| TEMA (21): | 11,369.6942 | |
| Williams %R (14): | 0.00 | |
| Chande Momentum Oscillator (20): | 160.6006 | |
| Repulse (5,40,3): | 0.4828 | |
| ROCnROLL: | 1 | |
| TRIX (15,9): | -0.0129 | |
| Courbe Coppock: | 0.79 |
| MA7: | 11,352.6430 | |
| MA20: | 11,384.4401 | |
| MA50: | 11,555.9420 | |
| MA100: | 11,271.0350 | |
| MAexp7: | 11,378.4234 | |
| MAexp20: | 11,355.4113 | |
| MAexp50: | 11,356.6635 | |
| MAexp100: | 11,375.1844 | |
| Price / MA7: | +0.60% | |
| Price / MA20: | +0.32% | |
| Price / MA50: | -1.17% | |
| Price / MA100: | +1.33% | |
| Price / MAexp7: | +0.37% | |
| Price / MAexp20: | +0.57% | |
| Price / MAexp50: | +0.56% | |
| Price / MAexp100: | +0.40% |
About author
Online


Add a comment
Comments
0 comments on the analysis FTSE4GOODIBX - 1H