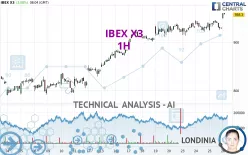
IBEX X3 - 1H - Technical analysis published on 09/26/2024 (GMT)
- 157
- 0
Click here for a new analysis!
- Timeframe : 1H
- - Analysis generated on
- Status : LEVEL MAINTAINED

Summary of the analysis

Additional analysis
Quotes
IBEX X3 rating 958.3000 EUR. The price has increased by +3.08% since the last closing and was between 949.9000 EUR and 960.9000 EUR. This implies that the price is at +0.88% from its lowest and at -0.27% from its highest.The Central Gaps scanner detects a bullish gap which is a sign that buyers have taken the lead in the very short term.
Opening Gap UP
Type : Bullish
Timeframe : Openning
A study of price movements over other periods shows the following variations:
New HIGH record (1 year)
Type : Bullish
Timeframe : Weekly
New HIGH record (1st january)
Type : Bullish
Timeframe : Weekly
New HIGH record (1 month)
Type : Bullish
Timeframe : Weekly
Technical
Technical analysis of this 1H chart of IBEX X3 indicates that the overall trend is strongly bullish. 92.86% of the signals given by moving averages are bullish. This strongly bullish trend is supported by the strong bullish signals given by short-term moving averages. The Central Indicators market scanner currently does not detect any result that concerns moving averages.
Technical indicators are strongly bullish, suggesting that the price increase should continue.
Caution: the Central Indicators scanner currently detects an excess:
CCI indicator is overbought : over 100
Type : Neutral
Timeframe : 1 hour
Williams %R indicator is overbought : over -20
Type : Neutral
Timeframe : 1 hour
Pivot points : price is over resistance 1
Type : Neutral
Timeframe : Weekly
Pivot points : price is over resistance 2
Type : Neutral
Timeframe : 1 hour
Central Patterns, the scanner specializing in chart patterns, did not identify any signals.
Central Candlesticks, the scanner specialised in Japanese candlesticks, detects this inversion signal that could impact the current short-term trend:
Doji
Type : Neutral
Timeframe : 1 hour
| S3 | S2 | S1 | Price | R1 | R2 | R3 | |
|---|---|---|---|---|---|---|---|
| ProTrendLines | 885.9000 | 922.3000 | 946.3400 | 958.3000 | 2,052.8335 | 3,607.0000 | 6,555.4000 |
| Change (%) | -7.56% | -3.76% | -1.25% | - | +114.22% | +276.40% | +584.07% |
| Change | -72.4000 | -36.0000 | -11.9600 | - | +1,094.5335 | +2,648.7000 | +5,597.1000 |
| Level | Major | Intermediate | Intermediate | - | Minor | Major | Minor |
Attention could also be paid to pivot points to set price objectives:
| Pivot points | S3 | S2 | S1 | PP | R1 | R2 | R3 |
|---|---|---|---|---|---|---|---|
| Standard | 898.8333 | 911.1667 | 920.4333 | 932.7667 | 942.0333 | 954.3667 | 963.6333 |
| Camarilla | 923.7600 | 925.7400 | 927.7200 | 929.7000 | 931.6800 | 933.6600 | 935.6400 |
| Woodie | 897.3000 | 910.4000 | 918.9000 | 932.0000 | 940.5000 | 953.6000 | 962.1000 |
| Fibonacci | 911.1667 | 919.4179 | 924.5155 | 932.7667 | 941.0179 | 946.1155 | 954.3667 |
| Pivot points | S3 | S2 | S1 | PP | R1 | R2 | R3 |
|---|---|---|---|---|---|---|---|
| Standard | 807.1000 | 836.9000 | 879.2000 | 909.0000 | 951.3000 | 981.1000 | 1,023.4000 |
| Camarilla | 901.6725 | 908.2817 | 914.8908 | 921.5000 | 928.1092 | 934.7183 | 941.3275 |
| Woodie | 813.3500 | 840.0250 | 885.4500 | 912.1250 | 957.5500 | 984.2250 | 1,029.6500 |
| Fibonacci | 836.9000 | 864.4422 | 881.4578 | 909.0000 | 936.5422 | 953.5578 | 981.1000 |
| Pivot points | S3 | S2 | S1 | PP | R1 | R2 | R3 |
|---|---|---|---|---|---|---|---|
| Standard | 470.5333 | 549.3667 | 698.2333 | 777.0667 | 925.9333 | 1,004.7667 | 1,153.6333 |
| Camarilla | 784.4825 | 805.3550 | 826.2275 | 847.1000 | 867.9725 | 888.8450 | 909.7175 |
| Woodie | 505.5500 | 566.8750 | 733.2500 | 794.5750 | 960.9500 | 1,022.2750 | 1,188.6500 |
| Fibonacci | 549.3667 | 636.3481 | 690.0853 | 777.0667 | 864.0481 | 917.7853 | 1,004.7667 |
Numerical data
The following is the status of the technical indicators and moving averages at the time of publication of this technical analysis:
| RSI (14): | 68.47 | |
| MACD (12,26,9): | 3.9197 | |
| Directional Movement: | 18.7582 | |
| AROON (14): | 85.7143 | |
| DEMA (21): | 941.1644 | |
| Parabolic SAR (0,02-0,02-0,2): | 926.1000 | |
| Elder Ray (13): | 16.8259 | |
| Super Trend (3,10): | 933.7782 | |
| Zig ZAG (10): | 960.4000 | |
| VORTEX (21): | 0.9994 | |
| Stochastique (14,3,5): | 75.28 | |
| TEMA (21): | 945.5018 | |
| Williams %R (14): | -3.67 | |
| Chande Momentum Oscillator (20): | 27.5000 | |
| Repulse (5,40,3): | 0.5049 | |
| ROCnROLL: | 1 | |
| TRIX (15,9): | 0.0510 | |
| Courbe Coppock: | 1.56 |
| MA7: | 930.8286 | |
| MA20: | 869.3600 | |
| MA50: | 806.5060 | |
| MA100: | 814.5070 | |
| MAexp7: | 944.9827 | |
| MAexp20: | 936.2466 | |
| MAexp50: | 925.3114 | |
| MAexp100: | 902.9165 | |
| Price / MA7: | +2.95% | |
| Price / MA20: | +10.23% | |
| Price / MA50: | +18.82% | |
| Price / MA100: | +17.65% | |
| Price / MAexp7: | +1.41% | |
| Price / MAexp20: | +2.36% | |
| Price / MAexp50: | +3.57% | |
| Price / MAexp100: | +6.13% |
About author
Online


Add a comment
Comments
0 comments on the analysis IBEX X3 - 1H