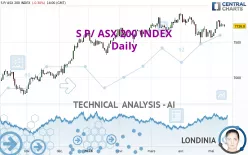
S P/ ASX 200 INDEX - Daily - Technical analysis published on 05/15/2024 (GMT)
- 143
- 0
Click here for a new analysis!
- Timeframe : Daily
- - Analysis generated on
- Status : TARGET REACHED

Summary of the analysis

Additional analysis
Quotes
The S P/ ASX 200 INDEX rating is 7,726.80 AUD. On the day, this instrument lost -0.30% and was between 7,714.60 AUD and 7,750.00 AUD. This implies that the price is at +0.16% from its lowest and at -0.30% from its highest.A study of price movements over other periods shows the following variations:
Near a new HIGH record (5 years)
Type : Bullish
Timeframe : Weekly
Near a new HIGH record (1 year)
Type : Bullish
Timeframe : Weekly
Near a new HIGH record (1st january)
Type : Bullish
Timeframe : Weekly
Near a new LOW record (1 month)
Type : Bearish
Timeframe : Weekly
Technical
Technical analysis of this Daily chart of S P/ ASX 200 INDEX indicates that the overall trend is bullish. 78.57% of the signals given by moving averages are bullish. The overall trend seems to be showing some signs of weakness, as do the tentative bullish signals given by short-term moving averages. The Central Indicators scanner detects a bearish signal on moving averages that could impact this trend:
Bearish price crossover with Moving Average 50
Type : Bearish
Timeframe : Daily
In fact, 12 technical indicators on 18 studied are currently bullish. Central Indicators, the scanner specialised in technical indicators, has identified these signals:
Pivot points : price is under support 1
Type : Neutral
Timeframe : Daily
Price is back under the pivot point
Type : Bearish
Timeframe : Weekly
Central Patterns, the scanner specializing in chart patterns, did not identify any signals.
The Central Candlesticks scanner which studies Japanese candlesticks did not detect anything.
| S3 | S2 | S1 | Price | R1 | |
|---|---|---|---|---|---|
| ProTrendLines | 7,125.20 | 7,350.13 | 7,621.68 | 7,726.80 | 7,896.90 |
| Change (%) | -7.79% | -4.87% | -1.36% | - | +2.20% |
| Change | -601.60 | -376.67 | -105.12 | - | +170.10 |
| Level | Intermediate | Minor | Major | - | Major |
Pivot points can also be used to set your price objectives. Here is the price situation in relation to pivot points:
| Pivot points | S3 | S2 | S1 | PP | R1 | R2 | R3 |
|---|---|---|---|---|---|---|---|
| Standard | 7,675.53 | 7,695.07 | 7,710.93 | 7,730.47 | 7,746.33 | 7,765.87 | 7,781.73 |
| Camarilla | 7,717.07 | 7,720.31 | 7,723.56 | 7,726.80 | 7,730.05 | 7,733.29 | 7,736.54 |
| Woodie | 7,673.70 | 7,694.15 | 7,709.10 | 7,729.55 | 7,744.50 | 7,764.95 | 7,779.90 |
| Fibonacci | 7,695.07 | 7,708.59 | 7,716.94 | 7,730.47 | 7,743.99 | 7,752.34 | 7,765.87 |
| Pivot points | S3 | S2 | S1 | PP | R1 | R2 | R3 |
|---|---|---|---|---|---|---|---|
| Standard | 7,461.13 | 7,545.07 | 7,647.03 | 7,730.97 | 7,832.93 | 7,916.87 | 8,018.83 |
| Camarilla | 7,697.88 | 7,714.92 | 7,731.96 | 7,749.00 | 7,766.04 | 7,783.08 | 7,800.12 |
| Woodie | 7,470.15 | 7,549.58 | 7,656.05 | 7,735.48 | 7,841.95 | 7,921.38 | 8,027.85 |
| Fibonacci | 7,545.07 | 7,616.08 | 7,659.95 | 7,730.97 | 7,801.98 | 7,845.85 | 7,916.87 |
| Pivot points | S3 | S2 | S1 | PP | R1 | R2 | R3 |
|---|---|---|---|---|---|---|---|
| Standard | 7,049.73 | 7,271.17 | 7,467.63 | 7,689.07 | 7,885.53 | 8,106.97 | 8,303.43 |
| Camarilla | 7,549.18 | 7,587.49 | 7,625.79 | 7,664.10 | 7,702.41 | 7,740.72 | 7,779.02 |
| Woodie | 7,037.25 | 7,264.93 | 7,455.15 | 7,682.83 | 7,873.05 | 8,100.73 | 8,290.95 |
| Fibonacci | 7,271.17 | 7,430.80 | 7,529.43 | 7,689.07 | 7,848.70 | 7,947.33 | 8,106.97 |
Numerical data
The following is the status of technical indicators and moving averages registered at the time this technical analysis was created:
| RSI (14): | 51.97 | |
| MACD (12,26,9): | 5.8700 | |
| Directional Movement: | -4.85 | |
| AROON (14): | 35.71 | |
| DEMA (21): | 7,704.82 | |
| Parabolic SAR (0,02-0,02-0,2): | 7,535.07 | |
| Elder Ray (13): | 23.96 | |
| Super Trend (3,10): | 7,595.35 | |
| Zig ZAG (10): | 7,726.80 | |
| VORTEX (21): | 0.9800 | |
| Stochastique (14,3,5): | 73.45 | |
| TEMA (21): | 7,712.45 | |
| Williams %R (14): | -34.09 | |
| Chande Momentum Oscillator (20): | 43.80 | |
| Repulse (5,40,3): | 0.5600 | |
| ROCnROLL: | 1 | |
| TRIX (15,9): | -0.0300 | |
| Courbe Coppock: | 1.97 |
| MA7: | 7,733.57 | |
| MA20: | 7,668.25 | |
| MA50: | 7,728.08 | |
| MA100: | 7,642.37 | |
| MAexp7: | 7,726.33 | |
| MAexp20: | 7,704.24 | |
| MAexp50: | 7,688.13 | |
| MAexp100: | 7,602.57 | |
| Price / MA7: | -0.09% | |
| Price / MA20: | +0.76% | |
| Price / MA50: | -0.02% | |
| Price / MA100: | +1.10% | |
| Price / MAexp7: | +0.01% | |
| Price / MAexp20: | +0.29% | |
| Price / MAexp50: | +0.50% | |
| Price / MAexp100: | +1.63% |
About author

Online


Add a comment
Comments
0 comments on the analysis S P/ ASX 200 INDEX - Daily