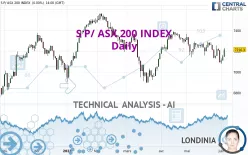
S P/ ASX 200 INDEX - Daily - Technical analysis published on 06/06/2023 (GMT)
- 167
- 0
Click here for a new analysis!
- Timeframe : Daily
- - Analysis generated on
- Status : LEVEL MAINTAINED

Summary of the analysis

Additional analysis
Quotes
The S P/ ASX 200 INDEX rating is 7,129.60 AUD. The price registered a decrease of -1.20% on the session and was between 7,125.90 AUD and 7,216.30 AUD. This implies that the price is at +0.05% from its lowest and at -1.20% from its highest.Here is a more detailed summary of the historical variations registered by S P/ ASX 200 INDEX:
Near a new HIGH record (1 year)
Type : Bullish
Timeframe : Weekly
Near a new HIGH record (1st january)
Type : Bullish
Timeframe : Weekly
Near a new HIGH record (1 month)
Type : Bullish
Timeframe : Weekly
Technical
A technical analysis in Daily of this S P/ ASX 200 INDEX chart shows a bearish trend. 71.43% of the signals given by moving averages are bearish. This bearish trend is supported by the strong bearish signals given by short-term moving averages. The Central Indicators market scanner is currently detecting several bearish signals that could impact this trend:
Bearish price crossover with Moving Average 20
Type : Bearish
Timeframe : Daily
Bearish price crossover with adaptative moving average 100
Type : Bearish
Timeframe : Daily
The probability of a further decline is moderate given the direction of the technical indicators.
Central Indicators, the detector scanner for these technical indicators has recently detected several signals:
Pivot points : price is under support 1
Type : Neutral
Timeframe : Daily
RSI indicator is back under 50
Type : Bearish
Timeframe : Daily
Williams %R indicator is back under -50
Type : Bearish
Timeframe : Daily
Central Patterns, the scanner specializing in chart patterns, did not identify any signals.
The Central Candlesticks scanner, specialised in Japanese candlesticks, did not identify any signals.
| S3 | S2 | S1 | Price | R1 | R2 | R3 | |
|---|---|---|---|---|---|---|---|
| ProTrendLines | 6,438.10 | 6,817.50 | 6,904.94 | 7,129.60 | 7,162.50 | 7,357.83 | 7,604.83 |
| Change (%) | -9.70% | -4.38% | -3.15% | - | +0.46% | +3.20% | +6.67% |
| Change | -691.50 | -312.10 | -224.66 | - | +32.90 | +228.23 | +475.23 |
| Level | Major | Minor | Major | - | Major | Intermediate | Major |
Attention could also be paid to pivot points to set price objectives:
| Pivot points | S3 | S2 | S1 | PP | R1 | R2 | R3 |
|---|---|---|---|---|---|---|---|
| Standard | 7,007.83 | 7,066.87 | 7,098.23 | 7,157.27 | 7,188.63 | 7,247.67 | 7,279.03 |
| Camarilla | 7,104.74 | 7,113.03 | 7,121.31 | 7,129.60 | 7,137.89 | 7,146.17 | 7,154.46 |
| Woodie | 6,994.00 | 7,059.95 | 7,084.40 | 7,150.35 | 7,174.80 | 7,240.75 | 7,265.20 |
| Fibonacci | 7,066.87 | 7,101.40 | 7,122.73 | 7,157.27 | 7,191.80 | 7,213.13 | 7,247.67 |
| Pivot points | S3 | S2 | S1 | PP | R1 | R2 | R3 |
|---|---|---|---|---|---|---|---|
| Standard | 6,886.83 | 6,982.37 | 7,063.73 | 7,159.27 | 7,240.63 | 7,336.17 | 7,417.53 |
| Camarilla | 7,096.45 | 7,112.67 | 7,128.88 | 7,145.10 | 7,161.32 | 7,177.53 | 7,193.75 |
| Woodie | 6,879.75 | 6,978.83 | 7,056.65 | 7,155.73 | 7,233.55 | 7,332.63 | 7,410.45 |
| Fibonacci | 6,982.37 | 7,049.94 | 7,091.69 | 7,159.27 | 7,226.84 | 7,268.59 | 7,336.17 |
| Pivot points | S3 | S2 | S1 | PP | R1 | R2 | R3 |
|---|---|---|---|---|---|---|---|
| Standard | 6,722.37 | 6,906.83 | 6,999.07 | 7,183.53 | 7,275.77 | 7,460.23 | 7,552.47 |
| Camarilla | 7,015.21 | 7,040.57 | 7,065.94 | 7,091.30 | 7,116.66 | 7,142.03 | 7,167.39 |
| Woodie | 6,676.25 | 6,883.78 | 6,952.95 | 7,160.48 | 7,229.65 | 7,437.18 | 7,506.35 |
| Fibonacci | 6,906.83 | 7,012.53 | 7,077.83 | 7,183.53 | 7,289.23 | 7,354.53 | 7,460.23 |
Numerical data
The following are the details of the technical indicators and moving averages that were collected to generate this technical analysis:
| RSI (14): | 42.98 | |
| MACD (12,26,9): | -28.0100 | |
| Directional Movement: | -3.68 | |
| AROON (14): | -64.28 | |
| DEMA (21): | 7,162.38 | |
| Parabolic SAR (0,02-0,02-0,2): | 7,081.01 | |
| Elder Ray (13): | -7.78 | |
| Super Trend (3,10): | 7,276.90 | |
| Zig ZAG (10): | 7,129.60 | |
| VORTEX (21): | 0.9500 | |
| Stochastique (14,3,5): | 39.95 | |
| TEMA (21): | 7,139.65 | |
| Williams %R (14): | -75.92 | |
| Chande Momentum Oscillator (20): | -149.90 | |
| Repulse (5,40,3): | -0.9700 | |
| ROCnROLL: | 2 | |
| TRIX (15,9): | -0.0400 | |
| Courbe Coppock: | 2.43 |
| MA7: | 7,159.97 | |
| MA20: | 7,206.57 | |
| MA50: | 7,223.46 | |
| MA100: | 7,273.24 | |
| MAexp7: | 7,161.31 | |
| MAexp20: | 7,194.96 | |
| MAexp50: | 7,220.62 | |
| MAexp100: | 7,210.18 | |
| Price / MA7: | -0.42% | |
| Price / MA20: | -1.07% | |
| Price / MA50: | -1.30% | |
| Price / MA100: | -1.97% | |
| Price / MAexp7: | -0.44% | |
| Price / MAexp20: | -0.91% | |
| Price / MAexp50: | -1.26% | |
| Price / MAexp100: | -1.12% |
About author

Online


Add a comment
Comments
0 comments on the analysis S P/ ASX 200 INDEX - Daily