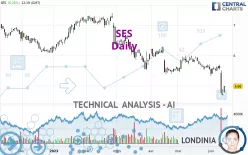
SES - Daily - Technical analysis published on 06/14/2023 (GMT)
- 261
- 0
Click here for a new analysis!
- Timeframe : Daily
- - Analysis generated on
- Status : INVALID

Summary of the analysis

Additional analysis
Quotes
The SES price is 4.990 EUR. On the day, this instrument gained +6.26% with the lowest point at 4.768 EUR and the highest point at 4.996 EUR. The deviation from the price is +4.66% for the low point and -0.12% for the high point.A bullish opening was detected by the Central Gaps scanner. Buyers are trying to impose a bullish momentum in the very short term.
Bullish opening
Type : Bullish
Timeframe : Openning
So that you have an overall view of the price change, here is a table showing the variations over several periods:
Near a new LOW record (1 year)
Type : Bearish
Timeframe : Weekly
Near a new LOW record (1st january)
Type : Bearish
Timeframe : Weekly
Near a new LOW record (1 month)
Type : Bearish
Timeframe : Weekly
Abnormal volumes on SES were detected by the Central Volumes scanner:
Abnormal volumes
Timeframe : 5 days
Technical
Technical analysis of this Daily chart of SES indicates that the overall trend is strongly bearish. 92.86% of the signals given by moving averages are bearish. This strongly bearish trend is supported by the strong bearish signals given by short-term moving averages. There is no crossing of moving average by the price or crossing of moving averages between themselves.
Technical indicators are bearish. There is still some doubt about the decline in the price.
But beware of excesses. The Central Indicators scanner currently detects this:
CCI indicator is oversold : under -100
Type : Neutral
Timeframe : Daily
Previous candle closed under Bollinger bands
Type : Neutral
Timeframe : Daily
Pivot points : price is over resistance 2
Type : Neutral
Timeframe : Daily
Pivot points : price is under support 3
Type : Neutral
Timeframe : Weekly
The analysis of the price chart with Central Patterns scanners does not return any result.
Central Candlesticks, the scanner specialised in Japanese candlesticks, detects a bullish signal that could support the hypothesis of a small rebound in the very short term:
White morning star
Type : Bullish
Timeframe : Daily
| S1 | Price | R1 | R2 | R3 | |
|---|---|---|---|---|---|
| ProTrendLines | 3.905 | 4.990 | 5.046 | 5.602 | 6.332 |
| Change (%) | -21.74% | - | +1.12% | +12.26% | +26.89% |
| Change | -1.085 | - | +0.056 | +0.612 | +1.342 |
| Level | Minor | - | Major | Intermediate | Minor |
Attention could also be paid to pivot points to set price objectives:
| Pivot points | S3 | S2 | S1 | PP | R1 | R2 | R3 |
|---|---|---|---|---|---|---|---|
| Standard | 4.421 | 4.557 | 4.627 | 4.763 | 4.833 | 4.969 | 5.039 |
| Camarilla | 4.639 | 4.658 | 4.677 | 4.696 | 4.715 | 4.734 | 4.753 |
| Woodie | 4.387 | 4.541 | 4.593 | 4.747 | 4.799 | 4.953 | 5.005 |
| Fibonacci | 4.557 | 4.636 | 4.685 | 4.763 | 4.842 | 4.891 | 4.969 |
| Pivot points | S3 | S2 | S1 | PP | R1 | R2 | R3 |
|---|---|---|---|---|---|---|---|
| Standard | 5.243 | 5.362 | 5.473 | 5.592 | 5.703 | 5.822 | 5.933 |
| Camarilla | 5.522 | 5.543 | 5.564 | 5.585 | 5.606 | 5.627 | 5.648 |
| Woodie | 5.240 | 5.360 | 5.470 | 5.590 | 5.700 | 5.820 | 5.930 |
| Fibonacci | 5.362 | 5.450 | 5.504 | 5.592 | 5.680 | 5.734 | 5.822 |
| Pivot points | S3 | S2 | S1 | PP | R1 | R2 | R3 |
|---|---|---|---|---|---|---|---|
| Standard | 4.768 | 5.107 | 5.328 | 5.667 | 5.888 | 6.227 | 6.448 |
| Camarilla | 5.396 | 5.447 | 5.499 | 5.550 | 5.601 | 5.653 | 5.704 |
| Woodie | 4.710 | 5.078 | 5.270 | 5.638 | 5.830 | 6.198 | 6.390 |
| Fibonacci | 5.107 | 5.321 | 5.453 | 5.667 | 5.881 | 6.013 | 6.227 |
Numerical data
The following is the status of technical indicators and moving averages registered at the time this technical analysis was created:
| RSI (14): | 35.43 | |
| MACD (12,26,9): | -0.1740 | |
| Directional Movement: | -26.074 | |
| AROON (14): | -71.428 | |
| DEMA (21): | 5.235 | |
| Parabolic SAR (0,02-0,02-0,2): | 5.669 | |
| Elder Ray (13): | -0.441 | |
| Super Trend (3,10): | 5.427 | |
| Zig ZAG (10): | 4.990 | |
| VORTEX (21): | 0.6790 | |
| Stochastique (14,3,5): | 11.98 | |
| TEMA (21): | 5.093 | |
| Williams %R (14): | -70.87 | |
| Chande Momentum Oscillator (20): | -0.665 | |
| Repulse (5,40,3): | -5.1010 | |
| ROCnROLL: | 2 | |
| TRIX (15,9): | -0.2060 | |
| Courbe Coppock: | 17.29 |
| MA7: | 5.264 | |
| MA20: | 5.511 | |
| MA50: | 5.604 | |
| MA100: | 5.877 | |
| MAexp7: | 5.159 | |
| MAexp20: | 5.422 | |
| MAexp50: | 5.596 | |
| MAexp100: | 5.767 | |
| Price / MA7: | -5.21% | |
| Price / MA20: | -9.45% | |
| Price / MA50: | -10.96% | |
| Price / MA100: | -15.09% | |
| Price / MAexp7: | -3.28% | |
| Price / MAexp20: | -7.97% | |
| Price / MAexp50: | -10.83% | |
| Price / MAexp100: | -13.47% |
News
The last news published on SES at the time of the generation of this analysis was as follows:
- SES Announces its Chief Executive Officer Steve Collar to Step Down
- SES Space & Defense Delivers Satellite Connectivity to AWS Modular Data Center for the U.S. Department of Defense
- SES Reaches 369 Million Homes Worldwide
- SES: Q1 2023 Results
- Profen to Deliver High Performance Networks across Türkiye and beyond with SES’s O3b mPOWER system
About author
Online


Add a comment
Comments
0 comments on the analysis SES - Daily