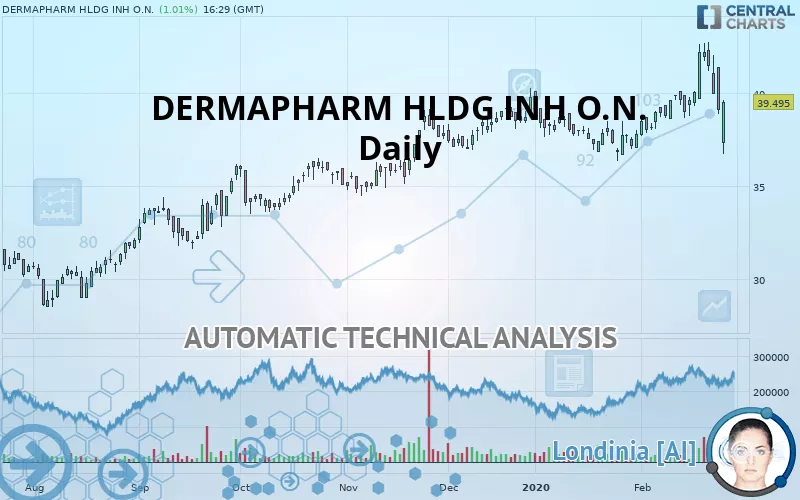
DERMAPHARM HLDG INH O.N. - Daily - Technical analysis published on 02/26/2020 (GMT)
- 349
- 0
Click here for a new analysis!
- Timeframe : Daily
- - Analysis generated on
- Status : INVALID

Summary of the analysis

Additional analysis
Quotes
The DERMAPHARM HLDG INH O.N. price is 39.495 EUR. The price is lower by +1.01% since the last closing and was between 36.700 EUR and 39.585 EUR. This implies that the price is at +7.62% from its lowest and at -0.23% from its highest.The Central Gaps scanner detects a bearish gap which is a sign that the sellers have taken the lead in the very short term.
Opening Gap DOWN
Type : Bearish
Timeframe : Openning
So that you have an overall view of the price change, here is a table showing the variations over several periods:
Near a new LOW record (1st january)
Type : Bearish
Timeframe : Weekly
Near a new LOW record (1 month)
Type : Bearish
Timeframe : Weekly
Technical
A technical analysis in Daily of this DERMAPHARM HLDG INH O.N. chart shows a strongly bullish trend. The signals given by moving averages are 82.14% bullish. This strongly bullish trend seems to be running out of steam given the signals being given by short-term moving averages. The Central Indicators market scanner is currently detecting several bearish signals that could impact this trend:
Bearish trend reversal : adaptative moving average 20
Type : Bearish
Timeframe : Daily
Bearish price crossover with Moving Average 20
Type : Bearish
Timeframe : Daily
In fact, only 8 technical indicators out of 18 studied are currently bearish. Central Indicators, the detector scanner for these technical indicators has recently detected several signals:
RSI indicator is back under 50
Type : Bearish
Timeframe : Daily
SuperTrend indicator bearish reversal
Type : Bearish
Timeframe : Daily
Price is back over the pivot point
Type : Bullish
Timeframe : Weekly
Price is back under the pivot point
Type : Bearish
Timeframe : Daily
Central Patterns, the market scanner focusing on chart patterns, resistances and supports found this result:
Near horizontal resistance
Type : Bearish
Timeframe : Daily
The Central Candlesticks scanner which studies Japanese candlesticks did not detect anything.
| S3 | S2 | S1 | Price | R1 | R2 | |
|---|---|---|---|---|---|---|
| ProTrendLines | 32.470 | 33.950 | 36.082 | 39.495 | 39.750 | 42.195 |
| Change (%) | -17.79% | -14.04% | -8.64% | - | +0.65% | +6.84% |
| Change | -7.025 | -5.545 | -3.413 | - | +0.255 | +2.700 |
| Level | Minor | Intermediate | Intermediate | - | Major | Intermediate |
Pivot points can also be used to set your price objectives. Here is the price situation in relation to pivot points:
| Pivot points | S3 | S2 | S1 | PP | R1 | R2 | R3 |
|---|---|---|---|---|---|---|---|
| Standard | 35.625 | 37.240 | 38.170 | 39.785 | 40.715 | 42.330 | 43.260 |
| Camarilla | 38.400 | 38.633 | 38.867 | 39.100 | 39.333 | 39.567 | 39.800 |
| Woodie | 35.283 | 37.069 | 37.828 | 39.614 | 40.373 | 42.159 | 42.918 |
| Fibonacci | 37.240 | 38.212 | 38.813 | 39.785 | 40.757 | 41.358 | 42.330 |
| Pivot points | S3 | S2 | S1 | PP | R1 | R2 | R3 |
|---|---|---|---|---|---|---|---|
| Standard | 35.253 | 37.002 | 39.228 | 40.977 | 43.203 | 44.952 | 47.178 |
| Camarilla | 40.362 | 40.726 | 41.091 | 41.455 | 41.819 | 42.184 | 42.548 |
| Woodie | 35.493 | 37.121 | 39.468 | 41.096 | 43.443 | 45.071 | 47.418 |
| Fibonacci | 37.002 | 38.520 | 39.458 | 40.977 | 42.495 | 43.433 | 44.952 |
| Pivot points | S3 | S2 | S1 | PP | R1 | R2 | R3 |
|---|---|---|---|---|---|---|---|
| Standard | 32.267 | 34.293 | 36.037 | 38.063 | 39.807 | 41.833 | 43.577 |
| Camarilla | 36.743 | 37.089 | 37.434 | 37.780 | 38.126 | 38.471 | 38.817 |
| Woodie | 32.125 | 34.223 | 35.895 | 37.993 | 39.665 | 41.763 | 43.435 |
| Fibonacci | 34.293 | 35.734 | 36.623 | 38.063 | 39.504 | 40.393 | 41.833 |
Numerical data
The following are the details of the technical indicators and moving averages that were collected to generate this technical analysis:
| RSI (14): | 51.33 | |
| MACD (12,26,9): | 0.5740 | |
| Directional Movement: | -11.963 | |
| AROON (14): | -21.429 | |
| DEMA (21): | 40.315 | |
| Parabolic SAR (0,02-0,02-0,2): | 42.570 | |
| Elder Ray (13): | -1.733 | |
| Super Trend (3,10): | 42.566 | |
| Zig ZAG (10): | 39.540 | |
| VORTEX (21): | 0.9980 | |
| Stochastique (14,3,5): | 36.72 | |
| TEMA (21): | 40.552 | |
| Williams %R (14): | -52.78 | |
| Chande Momentum Oscillator (20): | 0.795 | |
| Repulse (5,40,3): | 1.2290 | |
| ROCnROLL: | -1 | |
| TRIX (15,9): | 0.2270 | |
| Courbe Coppock: | 10.14 |
| MA7: | 40.601 | |
| MA20: | 39.400 | |
| MA50: | 38.670 | |
| MA100: | 37.310 | |
| MAexp7: | 40.044 | |
| MAexp20: | 39.565 | |
| MAexp50: | 38.628 | |
| MAexp100: | 37.285 | |
| Price / MA7: | -2.72% | |
| Price / MA20: | +0.24% | |
| Price / MA50: | +2.13% | |
| Price / MA100: | +5.86% | |
| Price / MAexp7: | -1.37% | |
| Price / MAexp20: | -0.18% | |
| Price / MAexp50: | +2.24% | |
| Price / MAexp100: | +5.93% |
News
The latest news and videos published on DERMAPHARM HLDG INH O.N. at the time of the analysis were as follows:
- DGAP-News: Dermapharm Holding SE to acquire Allergopharma
- DGAP-Adhoc: Dermapharm Holding SE: Acquisition of Allergopharma
- DGAP-News: Dermapharm Holding SE opens new logistics center in Brehna
- DGAP-News: Dermapharm Holding SE continues to drive the company's growth in the third quarter of 2019
- DGAP-News: Dermapharm confirms profitable growth in first half of 2019
About author

Online


Add a comment
Comments
0 comments on the analysis DERMAPHARM HLDG INH O.N. - Daily