DERMAPHARM HLDG INH O.N. - 1H - Technical analysis published on 09/16/2024 (GMT)
- 108
- 0
Click here for a new analysis!
- Timeframe : 1H
- - Analysis generated on
- Status : INVALID

Summary of the analysis

Additional analysis
Quotes
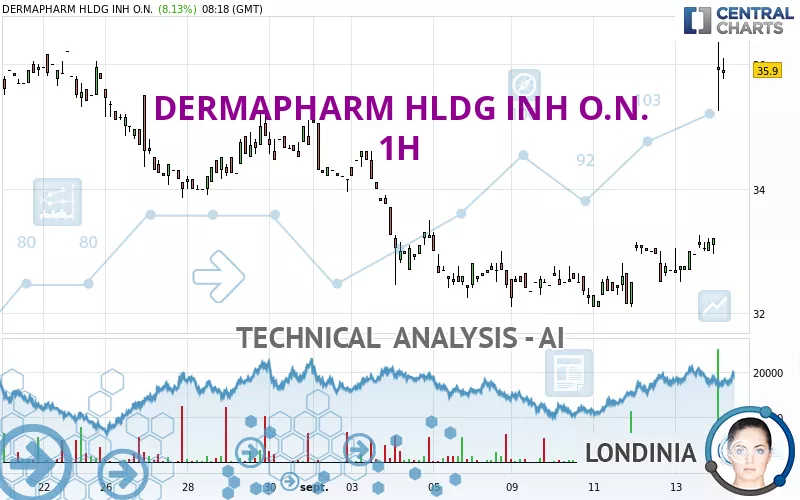
The DERMAPHARM HLDG INH O.N. price is 35.90 EUR. The price registered an increase of +8.13% on the session with the lowest point at 35.25 EUR and the highest point at 36.35 EUR. The deviation from the price is +1.84% for the low point and -1.24% for the high point.The Central Gaps scanner detects the formation of a bullish gap marking the strong presence of buyers against sellers at the opening. This formed a quotation gap.
Opening Gap UP
Type : Bullish
Timeframe : Openning
Here is a more detailed summary of the historical variations registered by DERMAPHARM HLDG INH O.N.:
Near a new LOW record (1 month)
Type : Bearish
Timeframe : Weekly
Technical
A technical analysis in 1H of this DERMAPHARM HLDG INH O.N. chart shows a strongly bullish trend. 82.14% of the signals given by moving averages are bullish. The overall trend is supported by the strong bullish signals from short-term moving averages. The Central Indicators scanner detects bullish signals on moving averages that could impact this trend:
Bullish trend reversal : Moving Average 100
Type : Bullish
Timeframe : 1 hour
Bullish trend reversal : adaptative moving average 100
Type : Bullish
Timeframe : 1 hour
Moving Average bullish crossovers : AMA50 & AMA100
Type : Bullish
Timeframe : 1 hour
In fact, according to the parameters integrated into the Central Analyzer system, 17 technical indicators out of 18 analysed are currently bullish. Caution: the Central Indicators scanner currently detects an excess:
RSI indicator is overbought : over 80
Type : Neutral
Timeframe : 1 hour
CCI indicator is overbought : over 100
Type : Neutral
Timeframe : 1 hour
Previous candle closed over Bollinger bands
Type : Neutral
Timeframe : 1 hour
Williams %R indicator is overbought : over -20
Type : Neutral
Timeframe : 1 hour
Pivot points : price is over resistance 3
Type : Neutral
Timeframe : 1 hour
Central Patterns, the market scanner focusing on chart patterns, resistances and supports found this result:
Resistance of channel is broken
Type : Bullish
Timeframe : 1 hour
The Central Candlesticks scanner which studies Japanese candlesticks did not detect anything.
| S3 | S2 | S1 | Price | R1 | R2 | R3 | |
|---|---|---|---|---|---|---|---|
| ProTrendLines | 33.86 | 35.49 | 35.82 | 35.90 | 36.20 | 38.35 | 40.03 |
| Change (%) | -5.68% | -1.14% | -0.22% | - | +0.84% | +6.82% | +11.50% |
| Change | -2.04 | -0.41 | -0.08 | - | +0.30 | +2.45 | +4.13 |
| Level | Minor | Minor | Major | - | Major | Intermediate | Minor |
Attention could also be paid to pivot points to set price objectives:
| Pivot points | S3 | S2 | S1 | PP | R1 | R2 | R3 |
|---|---|---|---|---|---|---|---|
| Standard | 31.97 | 32.23 | 32.72 | 32.98 | 33.47 | 33.73 | 34.22 |
| Camarilla | 32.99 | 33.06 | 33.13 | 33.20 | 33.27 | 33.34 | 33.41 |
| Woodie | 32.08 | 32.29 | 32.83 | 33.04 | 33.58 | 33.79 | 34.33 |
| Fibonacci | 32.23 | 32.52 | 32.70 | 32.98 | 33.27 | 33.45 | 33.73 |
| Pivot points | S3 | S2 | S1 | PP | R1 | R2 | R3 |
|---|---|---|---|---|---|---|---|
| Standard | 31.30 | 31.70 | 32.45 | 32.85 | 33.60 | 34.00 | 34.75 |
| Camarilla | 32.88 | 32.99 | 33.10 | 33.20 | 33.31 | 33.41 | 33.52 |
| Woodie | 31.48 | 31.79 | 32.63 | 32.94 | 33.78 | 34.09 | 34.93 |
| Fibonacci | 31.70 | 32.14 | 32.41 | 32.85 | 33.29 | 33.56 | 34.00 |
| Pivot points | S3 | S2 | S1 | PP | R1 | R2 | R3 |
|---|---|---|---|---|---|---|---|
| Standard | 30.90 | 32.30 | 33.50 | 34.90 | 36.10 | 37.50 | 38.70 |
| Camarilla | 33.99 | 34.22 | 34.46 | 34.70 | 34.94 | 35.18 | 35.42 |
| Woodie | 30.80 | 32.25 | 33.40 | 34.85 | 36.00 | 37.45 | 38.60 |
| Fibonacci | 32.30 | 33.29 | 33.91 | 34.90 | 35.89 | 36.51 | 37.50 |
Numerical data
The following is the status of the technical indicators and moving averages at the time of publication of this technical analysis:
| RSI (14): | 85.54 | |
| MACD (12,26,9): | 0.5400 | |
| Directional Movement: | 56.30 | |
| AROON (14): | 85.72 | |
| DEMA (21): | 34.01 | |
| Parabolic SAR (0,02-0,02-0,2): | 32.70 | |
| Elder Ray (13): | 2.13 | |
| Super Trend (3,10): | 34.41 | |
| Zig ZAG (10): | 36.00 | |
| VORTEX (21): | 1.0600 | |
| Stochastique (14,3,5): | 91.28 | |
| TEMA (21): | 34.50 | |
| Williams %R (14): | -9.09 | |
| Chande Momentum Oscillator (20): | 3.25 | |
| Repulse (5,40,3): | 1.7100 | |
| ROCnROLL: | 1 | |
| TRIX (15,9): | 0.1000 | |
| Courbe Coppock: | 7.65 |
| MA7: | 33.09 | |
| MA20: | 34.05 | |
| MA50: | 34.92 | |
| MA100: | 35.45 | |
| MAexp7: | 34.33 | |
| MAexp20: | 33.43 | |
| MAexp50: | 33.09 | |
| MAexp100: | 33.34 | |
| Price / MA7: | +8.49% | |
| Price / MA20: | +5.43% | |
| Price / MA50: | +2.81% | |
| Price / MA100: | +1.27% | |
| Price / MAexp7: | +4.57% | |
| Price / MAexp20: | +7.39% | |
| Price / MAexp50: | +8.49% | |
| Price / MAexp100: | +7.68% |
News
The latest news and videos published on DERMAPHARM HLDG INH O.N. at the time of the analysis were as follows:
- EQS-News: Dermapharm Holding SE: High-margin existing business in branded pharmaceuticals segment drives organic growth at German and international companies
- EQS-News: Sustained organic growth in high-margin existing branded pharmaceutical business
- EQS-News: Dermapharm Holding SE: Annual General Meeting resolves dividend distribution of EUR 0.88 per share
- EQS-News: Strong organic growth in core markets underscores resilience of Dermapharm Holding SE's corporate strategy
- EQS-News: Dermapharm Holding SE fulfils all expectations despite multiple macroeconomic challenges
About author
Online


Add a comment
Comments
0 comments on the analysis DERMAPHARM HLDG INH O.N. - 1H