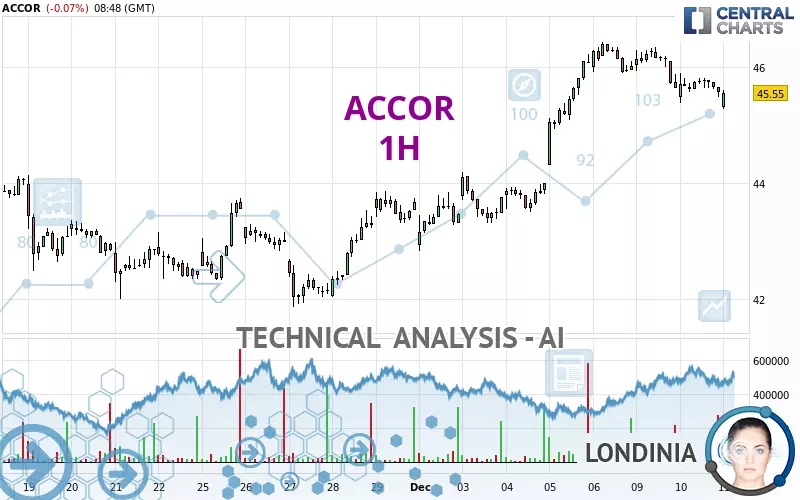
ACCOR - 1H - Technical analysis published on 12/11/2024 (GMT)
- 128
- 0
Click here for a new analysis!
- Timeframe : 1H
- - Analysis generated on
- Status : TARGET REACHED

Summary of the analysis

Additional analysis
Quotes
The ACCOR price is 45.55 EUR. The price registered a decrease of -0.07% on the session and was traded between 45.29 EUR and 45.61 EUR over the period. The price is currently at +0.57% from its lowest and -0.13% from its highest.A bearish gap was detected at the opening by the Central Gaps scanner. There are a lot of sellers and they have the upper hand in the very short term.
Opening Gap DOWN
Type : Bearish
Timeframe : Openning
A study of price movements over other periods shows the following variations:
Near a new HIGH record (5 years)
Type : Bullish
Timeframe : Weekly
Near a new HIGH record (1 year)
Type : Bullish
Timeframe : Weekly
Near a new HIGH record (1st january)
Type : Bullish
Timeframe : Weekly
Technical
Technical analysis of this 1H chart of ACCOR indicates that the overall trend is bullish. The signals given by moving averages are 71.43% bullish. This bullish trend could slow down given the neutral signals currently being given by short-term moving averages. The Central Indicators market scanner currently does not detect any result that concerns moving averages.
In fact, Central Analyzer took into account 18 technical indicators and the result was as follows: 4 are bullish, 7 are neutral and 7 are bearish. Caution: the Central Indicators scanner currently detects an excess:
CCI indicator is oversold : under -100
Type : Neutral
Timeframe : 1 hour
Williams %R indicator is oversold : under -80
Type : Neutral
Timeframe : 1 hour
Pivot points : price is under support 1
Type : Neutral
Timeframe : 1 hour
Central Patterns, the market scanner focusing on chart patterns, resistances and supports found this result:
Near support of channel
Type : Bullish
Timeframe : 1 hour
No result was found by the Central Candlesticks scanner on Japanese candlesticks.
| S3 | S2 | S1 | Price | R1 | R2 | |
|---|---|---|---|---|---|---|
| ProTrendLines | 42.83 | 44.36 | 45.38 | 45.55 | 45.90 | 46.35 |
| Change (%) | -5.97% | -2.61% | -0.37% | - | +0.77% | +1.76% |
| Change | -2.72 | -1.19 | -0.17 | - | +0.35 | +0.80 |
| Level | Intermediate | Major | Minor | - | Minor | Major |
Pivot points can also be used to set your price objectives. Here is the price situation in relation to pivot points:
| Pivot points | S3 | S2 | S1 | PP | R1 | R2 | R3 |
|---|---|---|---|---|---|---|---|
| Standard | 44.81 | 45.09 | 45.34 | 45.62 | 45.87 | 46.15 | 46.40 |
| Camarilla | 45.43 | 45.48 | 45.53 | 45.58 | 45.63 | 45.68 | 45.73 |
| Woodie | 44.79 | 45.08 | 45.32 | 45.61 | 45.85 | 46.14 | 46.38 |
| Fibonacci | 45.09 | 45.30 | 45.42 | 45.62 | 45.83 | 45.95 | 46.15 |
| Pivot points | S3 | S2 | S1 | PP | R1 | R2 | R3 |
|---|---|---|---|---|---|---|---|
| Standard | 40.14 | 41.49 | 43.75 | 45.10 | 47.36 | 48.71 | 50.97 |
| Camarilla | 45.03 | 45.36 | 45.69 | 46.02 | 46.35 | 46.68 | 47.01 |
| Woodie | 40.61 | 41.72 | 44.22 | 45.33 | 47.83 | 48.94 | 51.44 |
| Fibonacci | 41.49 | 42.87 | 43.72 | 45.10 | 46.48 | 47.33 | 48.71 |
| Pivot points | S3 | S2 | S1 | PP | R1 | R2 | R3 |
|---|---|---|---|---|---|---|---|
| Standard | 38.26 | 39.73 | 41.70 | 43.17 | 45.14 | 46.61 | 48.58 |
| Camarilla | 42.73 | 43.05 | 43.37 | 43.68 | 44.00 | 44.31 | 44.63 |
| Woodie | 38.52 | 39.86 | 41.96 | 43.30 | 45.40 | 46.74 | 48.84 |
| Fibonacci | 39.73 | 41.04 | 41.85 | 43.17 | 44.48 | 45.29 | 46.61 |
Numerical data
The following is the status of the technical indicators and moving averages at the time of publication of this technical analysis:
| RSI (14): | 45.64 | |
| MACD (12,26,9): | 0.0500 | |
| Directional Movement: | -12.46 | |
| AROON (14): | -35.72 | |
| DEMA (21): | 45.91 | |
| Parabolic SAR (0,02-0,02-0,2): | 45.84 | |
| Elder Ray (13): | -0.19 | |
| Super Trend (3,10): | 46.16 | |
| Zig ZAG (10): | 45.58 | |
| VORTEX (21): | 0.8400 | |
| Stochastique (14,3,5): | 29.55 | |
| TEMA (21): | 45.64 | |
| Williams %R (14): | -79.38 | |
| Chande Momentum Oscillator (20): | -0.58 | |
| Repulse (5,40,3): | -0.1400 | |
| ROCnROLL: | -1 | |
| TRIX (15,9): | 0.0500 | |
| Courbe Coppock: | 1.95 |
| MA7: | 44.94 | |
| MA20: | 43.80 | |
| MA50: | 42.35 | |
| MA100: | 39.61 | |
| MAexp7: | 45.71 | |
| MAexp20: | 45.76 | |
| MAexp50: | 45.29 | |
| MAexp100: | 44.59 | |
| Price / MA7: | +1.36% | |
| Price / MA20: | +4.00% | |
| Price / MA50: | +7.56% | |
| Price / MA100: | +15.00% | |
| Price / MAexp7: | -0.35% | |
| Price / MAexp20: | -0.46% | |
| Price / MAexp50: | +0.57% | |
| Price / MAexp100: | +2.15% |
News
The latest news and videos published on ACCOR at the time of the analysis were as follows:
- Trend Micro Celebrates Cybersecurity Excellence with Accor, Dole, and Others
- Accor strengthens leadership in Australian hotel industry with partnership renewals for over 40 hotels
- Industry Experts from IHG Hotels & Resorts, Accor Greater China, Radisson and More to Address Hospitality Investment Trends at Questex's IHIF Asia 2024
- Kylian Mbappé and Accor Forge Alliance to Empower Younger Generations
- Kylian Mbappé and Accor Forge Alliance to Empower Younger Generations
About author
Online


Add a comment
Comments
0 comments on the analysis ACCOR - 1H