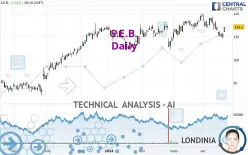
S.E.B. - Daily - Technical analysis published on 04/22/2024 (GMT)
- 226
- 0
Click here for a new analysis!
- Timeframe : Daily
- - Analysis generated on
- Status : TARGET REACHED

Summary of the analysis

Additional analysis
Quotes
S.E.B. rating 114.2 EUR. On the day, this instrument gained +2.51% with the lowest point at 112.0 EUR and the highest point at 114.2 EUR. The deviation from the price is +1.96% for the low point and 0% for the high point.A bullish gap was detected at the opening by the Central Gaps scanner. There are a lot of buyers and they have the upper hand in the very short term.
Opening Gap UP
Type : Bullish
Timeframe : Openning
Here is a more detailed summary of the historical variations registered by S.E.B.:
Near a new LOW record (1 month)
Type : Bearish
Timeframe : Weekly
The Central Volumes scanner notes the presence of abnormal volumes:
Abnormal volumes
Timeframe : 50 days
Technical
Technical analysis of S.E.B. in Daily shows an overall bullish trend. The signals given by moving averages are 78.57% bullish. This bullish trend could slow down given the neutral signals currently being given by short-term moving averages. An assessment of moving averages reveals several bullish signals that could impact this trend:
Bullish price crossover with Moving Average 100
Type : Bullish
Timeframe : Daily
Bullish price crossover with adaptative moving average 20
Type : Bullish
Timeframe : Daily
Bullish price crossover with adaptative moving average 50
Type : Bullish
Timeframe : Daily
Bullish price crossover with adaptative moving average 100
Type : Bullish
Timeframe : Daily
The technical indicators are generally neutral. They do not provide relevant information on the direction of future price movements.
The Central Indicators scanner found this result concerning these indicators:
Pivot points : price is over resistance 2
Type : Neutral
Timeframe : Daily
The Central Patterns scanner, which studies chart patterns, resistances and supports, has identified this signal:
Near horizontal resistance
Type : Bearish
Timeframe : Daily
For a small rebound in the very short term, the Central Candlesticks scanner currently notes the presence of this bullish pattern in Japanese candlesticks:
Upside gap
Type : Bullish
Timeframe : Daily
| S3 | S2 | S1 | Price | R1 | R2 | R3 | |
|---|---|---|---|---|---|---|---|
| ProTrendLines | 106.9 | 110.7 | 113.8 | 114.2 | 119.0 | 122.1 | 131.7 |
| Change (%) | -6.39% | -3.06% | -0.35% | - | +4.20% | +6.92% | +15.32% |
| Change | -7.3 | -3.5 | -0.4 | - | +4.8 | +7.9 | +17.5 |
| Level | Major | Major | Major | - | Intermediate | Minor | Minor |
Pivot points can also be used to set your price objectives. Here is the price situation in relation to pivot points:
| Pivot points | S3 | S2 | S1 | PP | R1 | R2 | R3 |
|---|---|---|---|---|---|---|---|
| Standard | 107.5 | 108.3 | 109.9 | 110.7 | 112.3 | 113.1 | 114.7 |
| Camarilla | 110.7 | 111.0 | 111.2 | 111.4 | 111.6 | 111.8 | 112.1 |
| Woodie | 107.8 | 108.5 | 110.2 | 110.9 | 112.6 | 113.3 | 115.0 |
| Fibonacci | 108.3 | 109.3 | 109.8 | 110.7 | 111.7 | 112.2 | 113.1 |
| Pivot points | S3 | S2 | S1 | PP | R1 | R2 | R3 |
|---|---|---|---|---|---|---|---|
| Standard | 103.6 | 106.4 | 108.9 | 111.7 | 114.2 | 117.0 | 119.5 |
| Camarilla | 109.9 | 110.4 | 110.9 | 111.4 | 111.9 | 112.4 | 112.9 |
| Woodie | 103.5 | 106.3 | 108.8 | 111.6 | 114.1 | 116.9 | 119.4 |
| Fibonacci | 106.4 | 108.4 | 109.7 | 111.7 | 113.7 | 115.0 | 117.0 |
| Pivot points | S3 | S2 | S1 | PP | R1 | R2 | R3 |
|---|---|---|---|---|---|---|---|
| Standard | 100.1 | 104.5 | 111.5 | 115.9 | 122.9 | 127.3 | 134.3 |
| Camarilla | 115.5 | 116.5 | 117.6 | 118.6 | 119.7 | 120.7 | 121.7 |
| Woodie | 101.5 | 105.2 | 112.9 | 116.6 | 124.3 | 128.0 | 135.7 |
| Fibonacci | 104.5 | 108.8 | 111.5 | 115.9 | 120.2 | 122.9 | 127.3 |
Numerical data
The following is the status of the technical indicators and moving averages at the time of publication of this technical analysis:
| RSI (14): | 49.30 | |
| MACD (12,26,9): | -0.7000 | |
| Directional Movement: | -5.0 | |
| AROON (14): | -92.9 | |
| DEMA (21): | 113.2 | |
| Parabolic SAR (0,02-0,02-0,2): | 114.8 | |
| Elder Ray (13): | -0.5 | |
| Super Trend (3,10): | 117.5 | |
| Zig ZAG (10): | 113.7 | |
| VORTEX (21): | 1.0000 | |
| Stochastique (14,3,5): | 24.30 | |
| TEMA (21): | 111.9 | |
| Williams %R (14): | -52.10 | |
| Chande Momentum Oscillator (20): | -3.0 | |
| Repulse (5,40,3): | 2.1000 | |
| ROCnROLL: | 1 | |
| TRIX (15,9): | 0.0000 | |
| Courbe Coppock: | 7.60 |
| MA7: | 112.0 | |
| MA20: | 115.0 | |
| MA50: | 113.8 | |
| MA100: | 111.8 | |
| MAexp7: | 112.5 | |
| MAexp20: | 113.8 | |
| MAexp50: | 113.3 | |
| MAexp100: | 110.5 | |
| Price / MA7: | +1.96% | |
| Price / MA20: | -0.70% | |
| Price / MA50: | +0.35% | |
| Price / MA100: | +2.15% | |
| Price / MAexp7: | +1.51% | |
| Price / MAexp20: | +0.35% | |
| Price / MAexp50: | +0.79% | |
| Price / MAexp100: | +3.35% |
News
The last news published on S.E.B. at the time of the generation of this analysis was as follows:
- GROUPE SEB: Monthly Disclosure of the Total Number of Shares and Voting Rights – 31.07.2023
- Groupe SEB: 2023 Half-Year Financial Report Available
- APPOINTMENT: Groupe SEB: Cyril BUXTORF Has Been Appointed Senior Executive Vice-President, Products & Innovation, Member of the General Management Committee
- Groupe SEB: First Half 2023 Sales and Results
- Biannual Report on SEB S.A.’s Liquidity Agreement Entrusted to ROTHSCHILD MARTIN MAUREL – June 30th, 2023
About author
Online


Add a comment
Comments
0 comments on the analysis S.E.B. - Daily