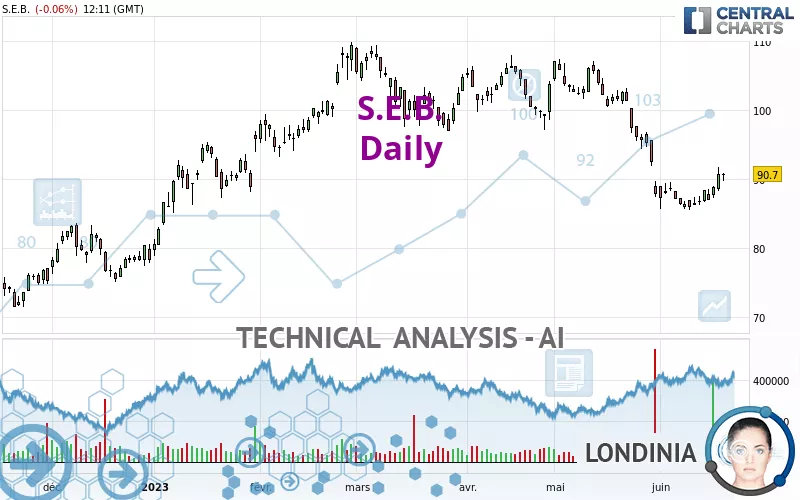
S.E.B. - Daily - Technical analysis published on 06/20/2023 (GMT)
- 219
- 0
- Timeframe : Daily
- - Analysis generated on
- Status : NEUTRAL

Summary of the analysis

Additional analysis
Quotes
S.E.B. rating 90.70 EUR. The price is lower by -0.06% since the last closing and was traded between 89.70 EUR and 90.95 EUR over the period. The price is currently at +1.11% from its lowest and -0.27% from its highest.The Central Gaps scanner detects a bearish opening. A small advantage for sellers in the very short term.
Bearish opening
Type : Bearish
Timeframe : Openning
A study of price movements over other periods shows the following variations:
Near a new LOW record (1 month)
Type : Bearish
Timeframe : Weekly
Technical
A technical analysis in Daily of this S.E.B. chart shows a slightly bearish trend. 60.71% of the signals given by moving averages are bearish. As the signals currently given by short-term moving averages are rather neutral, the slightly bearish trend could return to neutral. The Central Indicators scanner detects a bullish signal on moving averages that could impact this trend:
Bullish trend reversal : adaptative moving average 20
Type : Bullish
Timeframe : Daily
In fact, according to the parameters integrated into the Central Analyzer system, 12 technical indicators out of 18 analysed are currently bullish. But beware of excesses. The Central Indicators scanner currently detects this:
Williams %R indicator is overbought : over -20
Type : Neutral
Timeframe : Daily
Pivot points : price is over resistance 1
Type : Neutral
Timeframe : Weekly
Aroon indicator bullish trend
Type : Bullish
Timeframe : Daily
Central Patterns, the market scanner focusing on chart patterns, resistances and supports found these results:
Near resistance of channel
Type : Bearish
Timeframe : Daily
Near support of triangle
Type : Bullish
Timeframe : Daily
The Central Candlesticks scanner, specialised in Japanese candlesticks, did not identify any signals.
| S3 | S2 | S1 | Price | R1 | R2 | R3 | |
|---|---|---|---|---|---|---|---|
| ProTrendLines | 69.61 | 76.29 | 83.03 | 90.70 | 92.37 | 96.42 | 106.50 |
| Change (%) | -23.25% | -15.89% | -8.46% | - | +1.84% | +6.31% | +17.42% |
| Change | -21.09 | -14.41 | -7.67 | - | +1.67 | +5.72 | +15.80 |
| Level | Minor | Minor | Major | - | Intermediate | Intermediate | Major |
Pivot points can also be used to set your price objectives. Here is the price situation in relation to pivot points:
| Pivot points | S3 | S2 | S1 | PP | R1 | R2 | R3 |
|---|---|---|---|---|---|---|---|
| Standard | 85.18 | 86.72 | 88.73 | 90.27 | 92.28 | 93.82 | 95.83 |
| Camarilla | 89.77 | 90.10 | 90.43 | 90.75 | 91.08 | 91.40 | 91.73 |
| Woodie | 85.43 | 86.84 | 88.98 | 90.39 | 92.53 | 93.94 | 96.08 |
| Fibonacci | 86.72 | 88.07 | 88.91 | 90.27 | 91.62 | 92.46 | 93.82 |
| Pivot points | S3 | S2 | S1 | PP | R1 | R2 | R3 |
|---|---|---|---|---|---|---|---|
| Standard | 84.30 | 85.25 | 87.05 | 88.00 | 89.80 | 90.75 | 92.55 |
| Camarilla | 88.09 | 88.35 | 88.60 | 88.85 | 89.10 | 89.35 | 89.61 |
| Woodie | 84.73 | 85.46 | 87.48 | 88.21 | 90.23 | 90.96 | 92.98 |
| Fibonacci | 85.25 | 86.30 | 86.95 | 88.00 | 89.05 | 89.70 | 90.75 |
| Pivot points | S3 | S2 | S1 | PP | R1 | R2 | R3 |
|---|---|---|---|---|---|---|---|
| Standard | 64.87 | 76.16 | 81.98 | 93.27 | 99.09 | 110.38 | 116.20 |
| Camarilla | 83.10 | 84.66 | 86.23 | 87.80 | 89.37 | 90.94 | 92.51 |
| Woodie | 62.14 | 74.79 | 79.25 | 91.90 | 96.36 | 109.01 | 113.47 |
| Fibonacci | 76.16 | 82.70 | 86.73 | 93.27 | 99.81 | 103.84 | 110.38 |
Numerical data
The following is the status of technical indicators and moving averages registered at the time this technical analysis was created:
| RSI (14): | 48.11 | |
| MACD (12,26,9): | -2.0700 | |
| Directional Movement: | -4.35 | |
| AROON (14): | 42.86 | |
| DEMA (21): | 87.07 | |
| Parabolic SAR (0,02-0,02-0,2): | 86.06 | |
| Elder Ray (13): | 1.21 | |
| Super Trend (3,10): | 92.17 | |
| Zig ZAG (10): | 90.70 | |
| VORTEX (21): | 0.7800 | |
| Stochastique (14,3,5): | 69.95 | |
| TEMA (21): | 86.95 | |
| Williams %R (14): | -17.46 | |
| Chande Momentum Oscillator (20): | 2.35 | |
| Repulse (5,40,3): | 3.0100 | |
| ROCnROLL: | -1 | |
| TRIX (15,9): | -0.4500 | |
| Courbe Coppock: | 5.74 |
| MA7: | 88.41 | |
| MA20: | 89.05 | |
| MA50: | 95.90 | |
| MA100: | 97.09 | |
| MAexp7: | 89.03 | |
| MAexp20: | 90.15 | |
| MAexp50: | 93.48 | |
| MAexp100: | 93.29 | |
| Price / MA7: | +2.59% | |
| Price / MA20: | +1.85% | |
| Price / MA50: | -5.42% | |
| Price / MA100: | -6.58% | |
| Price / MAexp7: | +1.88% | |
| Price / MAexp20: | +0.61% | |
| Price / MAexp50: | -2.97% | |
| Price / MAexp100: | -2.78% |
News
The latest news and videos published on S.E.B. at the time of the analysis were as follows:
- GROUPE SEB: Monthly Disclosure of the Total Number of Shares and Voting Rights – 31.05.2023
- GROUPE SEB: Securities repurchasing programme weekly disclosure trading in own shares as of 23rd May 2023
- GROUPE SEB: Securities Repurchasing Programme Weekly Disclosure Trading in Own Shares of 16th May, 2023
- GROUPE SEB: Securities repurchasing programme weekly disclosure trading in own shares of 17th May, 2023
- GROUPE SEB: Securities Repurchasing Programme Weekly Disclosure Trading in Own Shares From 15th to 22nd May 2023
About author
Online


Add a comment
Comments
0 comments on the analysis S.E.B. - Daily