| Open: | - |
| Change: | - |
| Volume: | - |
| Low: | - |
| High: | - |
| High / Low range: | - |
| Type: | Stocks |
| Ticker: | SU |
| ISIN: | FR0000121972 |
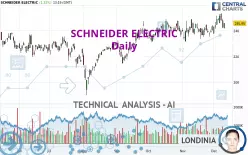
SCHNEIDER ELECTRIC - Daily - Technical analysis published on 12/11/2024 (GMT)
- 111
- 0
- 12/11/2024 - 13:35
Click here for a new analysis!
- Timeframe : Daily
- - Analysis generated on 12/11/2024 - 13:35
- Status : TARGET REACHED

Summary of the analysis

Additional analysis
Quotes
The SCHNEIDER ELECTRIC rating is 245.95 EUR. The price registered an increase of +1.32% on the session and was traded between 241.80 EUR and 246.05 EUR over the period. The price is currently at +1.72% from its lowest and -0.04% from its highest.The Central Gaps scanner detects a bearish opening. A small advantage for sellers in the very short term.
Bearish opening
Type : Bearish
Timeframe : Openning
So that you have an overall view of the price change, here is a table showing the variations over several periods:
New HIGH record (5 years)
Type : Bullish
Timeframe : Weekly
Near a new HIGH record (1 year)
Type : Bullish
Timeframe : Weekly
Near a new HIGH record (1st january)
Type : Bullish
Timeframe : Weekly
Near a new HIGH record (1 month)
Type : Bullish
Timeframe : Weekly
Technical
A technical analysis in Daily of this SCHNEIDER ELECTRIC chart shows a strongly bullish trend. 92.86% of the signals given by moving averages are bullish. The overall trend is supported by the strong bullish signals from short-term moving averages. The Central Indicators market scanner currently does not detect any result that concerns moving averages.
An assessment of technical indicators shows a slightly bullish signal.
Other results related to technical indicators were also found by the Central Indicators scanner:
RSI indicator is back over 50
Type : Bullish
Timeframe : Daily
Price is back over the pivot point
Type : Bullish
Timeframe : Daily
Price is back under the pivot point
Type : Bearish
Timeframe : Weekly
Williams %R indicator is back over -50
Type : Bullish
Timeframe : Daily
Central Patterns, the scanner specializing in chart patterns, did not identify any signals.
No result was found by the Central Candlesticks scanner on Japanese candlesticks.
| S3 | S2 | S1 | Price | R1 | |
|---|---|---|---|---|---|
| ProTrendLines | 221.12 | 236.41 | 244.67 | 245.95 | 248.80 |
| Change (%) | -10.10% | -3.88% | -0.52% | - | +1.16% |
| Change | -24.83 | -9.54 | -1.28 | - | +2.85 |
| Level | Minor | Major | Intermediate | - | Major |
Attention could also be paid to pivot points to set price objectives:
| Pivot points | S3 | S2 | S1 | PP | R1 | R2 | R3 |
|---|---|---|---|---|---|---|---|
| Standard | 232.88 | 237.42 | 240.08 | 244.62 | 247.28 | 251.82 | 254.48 |
| Camarilla | 240.77 | 241.43 | 242.09 | 242.75 | 243.41 | 244.07 | 244.73 |
| Woodie | 231.95 | 236.95 | 239.15 | 244.15 | 246.35 | 251.35 | 253.55 |
| Fibonacci | 237.42 | 240.17 | 241.87 | 244.62 | 247.37 | 249.07 | 251.82 |
| Pivot points | S3 | S2 | S1 | PP | R1 | R2 | R3 |
|---|---|---|---|---|---|---|---|
| Standard | 226.47 | 232.03 | 241.87 | 247.43 | 257.27 | 262.83 | 272.67 |
| Camarilla | 247.47 | 248.88 | 250.29 | 251.70 | 253.11 | 254.52 | 255.94 |
| Woodie | 228.60 | 233.10 | 244.00 | 248.50 | 259.40 | 263.90 | 274.80 |
| Fibonacci | 232.03 | 237.92 | 241.55 | 247.43 | 253.32 | 256.95 | 262.83 |
| Pivot points | S3 | S2 | S1 | PP | R1 | R2 | R3 |
|---|---|---|---|---|---|---|---|
| Standard | 216.38 | 224.07 | 233.78 | 241.47 | 251.18 | 258.87 | 268.58 |
| Camarilla | 238.72 | 240.31 | 241.91 | 243.50 | 245.10 | 246.69 | 248.29 |
| Woodie | 217.40 | 224.58 | 234.80 | 241.98 | 252.20 | 259.38 | 269.60 |
| Fibonacci | 224.07 | 230.71 | 234.82 | 241.47 | 248.11 | 252.22 | 258.87 |
Numerical data
The following is the status of technical indicators and moving averages registered at the time this technical analysis was created:
| RSI (14): | 54.02 | |
| MACD (12,26,9): | 1.8600 | |
| Directional Movement: | 3.93 | |
| AROON (14): | 85.71 | |
| DEMA (21): | 246.11 | |
| Parabolic SAR (0,02-0,02-0,2): | 239.19 | |
| Elder Ray (13): | -0.95 | |
| Super Trend (3,10): | 234.60 | |
| Zig ZAG (10): | 246.05 | |
| VORTEX (21): | 1.0000 | |
| Stochastique (14,3,5): | 56.26 | |
| TEMA (21): | 246.78 | |
| Williams %R (14): | -42.47 | |
| Chande Momentum Oscillator (20): | 5.70 | |
| Repulse (5,40,3): | 0.1800 | |
| ROCnROLL: | 1 | |
| TRIX (15,9): | 0.0800 | |
| Courbe Coppock: | 5.33 |
| MA7: | 247.20 | |
| MA20: | 242.91 | |
| MA50: | 241.54 | |
| MA100: | 232.75 | |
| MAexp7: | 245.97 | |
| MAexp20: | 243.88 | |
| MAexp50: | 240.59 | |
| MAexp100: | 235.02 | |
| Price / MA7: | -0.51% | |
| Price / MA20: | +1.25% | |
| Price / MA50: | +1.83% | |
| Price / MA100: | +5.67% | |
| Price / MAexp7: | -0.01% | |
| Price / MAexp20: | +0.85% | |
| Price / MAexp50: | +2.23% | |
| Price / MAexp100: | +4.65% |
News
The latest news and videos published on SCHNEIDER ELECTRIC at the time of the analysis were as follows:
- 12/06/2024 - 08:45 Schneider Electric Wins 'Business Continuity/ Disaster Recovery Project of the Year' and 'ESG/CSR Company Initiative' at the SDC Awards 2024
- 12/05/2024 - 14:45 Schneider Electric’s New Researches Forecast AI’s Impact on Energy Consumption
- 12/05/2024 - 10:04 Schneider Electric’s new research forecasts AI’s impact on energy consumption
- 12/04/2024 - 14:45 Schneider Electric and Alstom Target Environmental Impact of Mobility Industry
- 12/04/2024 - 13:35 Schneider Electric Announces New Solutions to Address the Energy and Sustainability Challenges Spurred by AI
About author
Online


Add a comment
Comments
0 comments on the analysis SCHNEIDER ELECTRIC - Daily