SCHNEIDER ELECTRIC - Daily - Technical analysis published on 08/28/2024 (GMT)
- 143
- 0
Click here for a new analysis!
- Timeframe : Daily
- - Analysis generated on
- Status : INVALID
Summary of the analysis

Additional analysis
Quotes
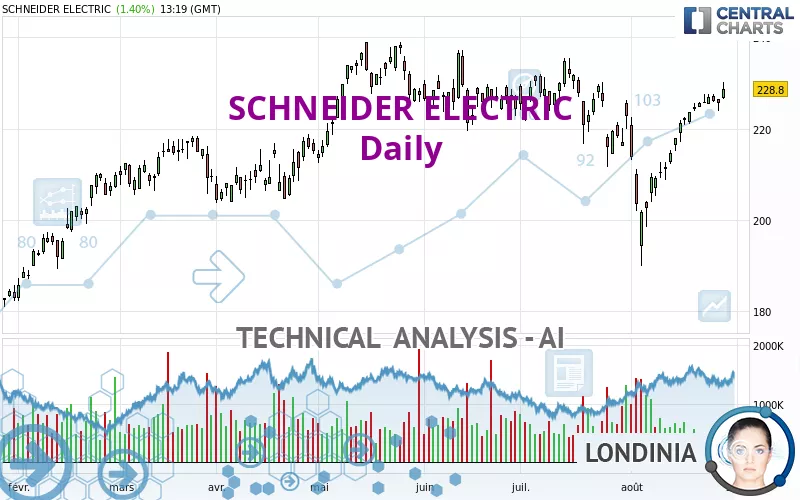
The SCHNEIDER ELECTRIC rating is 228.80 EUR. The price has increased by +1.40% since the last closing with the lowest point at 226.45 EUR and the highest point at 230.25 EUR. The deviation from the price is +1.04% for the low point and -0.63% for the high point.The Central Gaps scanner detects a bullish gap which is a sign that buyers have taken the lead in the very short term.
Opening Gap UP
Type : Bullish
Timeframe : Openning
A study of price movements over other periods shows the following variations:
Near a new HIGH record (5 years)
Type : Bullish
Timeframe : Weekly
Near a new HIGH record (1 year)
Type : Bullish
Timeframe : Weekly
Near a new HIGH record (1st january)
Type : Bullish
Timeframe : Weekly
New HIGH record (1 month)
Type : Bullish
Timeframe : Weekly
Technical
Technical analysis of SCHNEIDER ELECTRIC in Daily shows a strongly overall bullish trend. The signals given by the moving averages are 85.71% bullish. This strong bullish trend is confirmed by the strong signals currently being given by short-term moving averages. An assessment of moving averages reveals a bullish signal that could impact this trend:
Moving Average bullish crossovers : AMA20 & AMA50
Type : Bullish
Timeframe : Daily
In fact, 14 technical indicators on 18 studied are currently bullish. But beware of excesses. The Central Indicators scanner currently detects this:
Williams %R indicator is overbought : over -20
Type : Neutral
Timeframe : Daily
Pivot points : price is over resistance 2
Type : Neutral
Timeframe : Daily
Ichimoku : price is over the cloud
Type : Bullish
Timeframe : Daily
An analysis of the price chart with the Central Patterns scanner (detector of chart patterns and resistances and supports) shows a result that can have an impact on the price change:
Near resistance of channel
Type : Bearish
Timeframe : Daily
The Central Candlesticks scanner, specialised in Japanese candlesticks, did not identify any signals.
| S3 | S2 | S1 | Price | R1 | |
|---|---|---|---|---|---|
| ProTrendLines | 201.60 | 214.76 | 221.20 | 228.80 | 236.60 |
| Change (%) | -11.89% | -6.14% | -3.32% | - | +3.41% |
| Change | -27.20 | -14.04 | -7.60 | - | +7.80 |
| Level | Major | Intermediate | Intermediate | - | Major |
Pivot points can also be used to set your price objectives. Here is the price situation in relation to pivot points:
| Pivot points | S3 | S2 | S1 | PP | R1 | R2 | R3 |
|---|---|---|---|---|---|---|---|
| Standard | 221.38 | 222.62 | 224.13 | 225.37 | 226.88 | 228.12 | 229.63 |
| Camarilla | 224.89 | 225.15 | 225.40 | 225.65 | 225.90 | 226.15 | 226.41 |
| Woodie | 221.53 | 222.69 | 224.28 | 225.44 | 227.03 | 228.19 | 229.78 |
| Fibonacci | 222.62 | 223.67 | 224.32 | 225.37 | 226.42 | 227.07 | 228.12 |
| Pivot points | S3 | S2 | S1 | PP | R1 | R2 | R3 |
|---|---|---|---|---|---|---|---|
| Standard | 215.92 | 218.43 | 222.67 | 225.18 | 229.42 | 231.93 | 236.17 |
| Camarilla | 225.04 | 225.66 | 226.28 | 226.90 | 227.52 | 228.14 | 228.76 |
| Woodie | 216.78 | 218.86 | 223.53 | 225.61 | 230.28 | 232.36 | 237.03 |
| Fibonacci | 218.43 | 221.01 | 222.61 | 225.18 | 227.76 | 229.36 | 231.93 |
| Pivot points | S3 | S2 | S1 | PP | R1 | R2 | R3 |
|---|---|---|---|---|---|---|---|
| Standard | 186.93 | 199.22 | 211.03 | 223.32 | 235.13 | 247.42 | 259.23 |
| Camarilla | 216.22 | 218.43 | 220.64 | 222.85 | 225.06 | 227.27 | 229.48 |
| Woodie | 186.70 | 199.10 | 210.80 | 223.20 | 234.90 | 247.30 | 259.00 |
| Fibonacci | 199.22 | 208.42 | 214.11 | 223.32 | 232.52 | 238.21 | 247.42 |
Numerical data
The following is the status of technical indicators and moving averages registered at the time this technical analysis was created:
| RSI (14): | 62.24 | |
| MACD (12,26,9): | 2.0500 | |
| Directional Movement: | 7.23 | |
| AROON (14): | 100.00 | |
| DEMA (21): | 223.53 | |
| Parabolic SAR (0,02-0,02-0,2): | 216.49 | |
| Elder Ray (13): | 5.14 | |
| Super Trend (3,10): | 216.95 | |
| Zig ZAG (10): | 228.85 | |
| VORTEX (21): | 1.0200 | |
| Stochastique (14,3,5): | 92.38 | |
| TEMA (21): | 226.86 | |
| Williams %R (14): | -6.54 | |
| Chande Momentum Oscillator (20): | 17.60 | |
| Repulse (5,40,3): | 0.9300 | |
| ROCnROLL: | 1 | |
| TRIX (15,9): | 0.0100 | |
| Courbe Coppock: | 16.13 |
| MA7: | 226.19 | |
| MA20: | 217.24 | |
| MA50: | 222.53 | |
| MA100: | 221.91 | |
| MAexp7: | 225.64 | |
| MAexp20: | 221.85 | |
| MAexp50: | 221.36 | |
| MAexp100: | 217.60 | |
| Price / MA7: | +1.15% | |
| Price / MA20: | +5.32% | |
| Price / MA50: | +2.82% | |
| Price / MA100: | +3.10% | |
| Price / MAexp7: | +1.40% | |
| Price / MAexp20: | +3.13% | |
| Price / MAexp50: | +3.36% | |
| Price / MAexp100: | +5.15% |
News
Don't forget to follow the news on SCHNEIDER ELECTRIC. At the time of publication of this analysis, the latest news was as follows:
- Schneider Electric Enhances X Series Connected Wiring Device Line with Matter Communications
- Maximizing the Potential of Smarter, Better, Circular Strategies
- Transforming Into a Modern, Resilient Europe
- Schneider Electric: Going for Gold in Home Energy Management
- Schneider Electric Recognized as a Leader in Building Decarbonization Consulting by Independent Research and Advisory Firm
About author
Online


Add a comment
Comments
0 comments on the analysis SCHNEIDER ELECTRIC - Daily