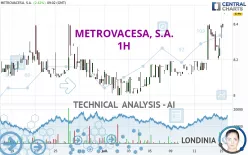
METROVACESA, S.A. - 1H - Technical analysis published on 07/15/2024 (GMT)
- 119
- 0
Click here for a new analysis!
- Timeframe : 1H
- - Analysis generated on
- Status : INVALID

Summary of the analysis

Additional analysis
Quotes
The METROVACESA, S.A. price is 8.46 EUR. The price has increased by +2.42% since the last closing and was traded between 8.32 EUR and 8.46 EUR over the period. The price is currently at +1.68% from its lowest and 0% from its highest.A study of price movements over other periods shows the following variations:
New HIGH record (1 month)
Type : Bullish
Timeframe : Weekly
Technical
Technical analysis of METROVACESA, S.A. in 1H shows a strongly overall bullish trend. 92.86% of the signals given by moving averages are bullish. The overall trend is supported by the strong bullish signals from short-term moving averages. The Central Indicators scanner does not detect any result on moving averages that would impact this trend.
In fact, 14 technical indicators on 18 studied are currently bullish. Caution: the Central Indicators scanner currently detects an excess:
CCI indicator is overbought : over 100
Type : Neutral
Timeframe : 1 hour
Williams %R indicator is overbought : over -20
Type : Neutral
Timeframe : 1 hour
Pivot points : price is over resistance 1
Type : Neutral
Timeframe : 1 hour
Parabolic SAR indicator bullish reversal
Type : Bullish
Timeframe : 1 hour
SuperTrend indicator bullish reversal
Type : Bullish
Timeframe : 1 hour
Central Patterns, the market scanner focusing on chart patterns, resistances and supports found these results:
Near resistance of channel
Type : Bearish
Timeframe : 1 hour
Near resistance of triangle
Type : Bearish
Timeframe : 1 hour
Central Candlesticks, the scanner specialised in Japanese candlesticks, detects these signals that could have an impact on the current short-term trend:
Bearish doji star
Type : Bearish
Timeframe : 1 hour
Doji
Type : Neutral
Timeframe : 1 hour
| S3 | S2 | S1 | Price | R1 | R2 | R3 | |
|---|---|---|---|---|---|---|---|
| ProTrendLines | 8.23 | 8.30 | 8.40 | 8.46 | 8.50 | 8.58 | 8.92 |
| Change (%) | -2.72% | -1.89% | -0.71% | - | +0.47% | +1.42% | +5.44% |
| Change | -0.23 | -0.16 | -0.06 | - | +0.04 | +0.12 | +0.46 |
| Level | Major | Minor | Major | - | Minor | Intermediate | Intermediate |
To determine price objectives, it is also possible to use the pivot points. Here is the price position in relation to pivot points:
| Pivot points | S3 | S2 | S1 | PP | R1 | R2 | R3 |
|---|---|---|---|---|---|---|---|
| Standard | 7.97 | 8.09 | 8.17 | 8.29 | 8.37 | 8.49 | 8.57 |
| Camarilla | 8.21 | 8.22 | 8.24 | 8.26 | 8.28 | 8.30 | 8.32 |
| Woodie | 7.96 | 8.08 | 8.16 | 8.28 | 8.36 | 8.48 | 8.56 |
| Fibonacci | 8.09 | 8.16 | 8.21 | 8.29 | 8.36 | 8.41 | 8.49 |
| Pivot points | S3 | S2 | S1 | PP | R1 | R2 | R3 |
|---|---|---|---|---|---|---|---|
| Standard | 7.76 | 7.91 | 8.09 | 8.24 | 8.42 | 8.57 | 8.75 |
| Camarilla | 8.17 | 8.20 | 8.23 | 8.26 | 8.29 | 8.32 | 8.35 |
| Woodie | 7.77 | 7.92 | 8.10 | 8.25 | 8.43 | 8.58 | 8.76 |
| Fibonacci | 7.91 | 8.04 | 8.12 | 8.24 | 8.37 | 8.45 | 8.57 |
| Pivot points | S3 | S2 | S1 | PP | R1 | R2 | R3 |
|---|---|---|---|---|---|---|---|
| Standard | 6.90 | 7.47 | 7.77 | 8.34 | 8.64 | 9.21 | 9.51 |
| Camarilla | 7.84 | 7.92 | 8.00 | 8.08 | 8.16 | 8.24 | 8.32 |
| Woodie | 6.78 | 7.40 | 7.65 | 8.27 | 8.52 | 9.14 | 9.39 |
| Fibonacci | 7.47 | 7.80 | 8.00 | 8.34 | 8.67 | 8.87 | 9.21 |
Numerical data
The following is the status of technical indicators and moving averages registered at the time this technical analysis was created:
| RSI (14): | 67.95 | |
| MACD (12,26,9): | 0.0600 | |
| Directional Movement: | 16.08 | |
| AROON (14): | 100.00 | |
| DEMA (21): | 8.35 | |
| Parabolic SAR (0,02-0,02-0,2): | 8.20 | |
| Elder Ray (13): | 0.14 | |
| Super Trend (3,10): | 8.29 | |
| Zig ZAG (10): | 8.46 | |
| VORTEX (21): | 1.1200 | |
| Stochastique (14,3,5): | 97.44 | |
| TEMA (21): | 8.38 | |
| Williams %R (14): | 0.00 | |
| Chande Momentum Oscillator (20): | 0.28 | |
| Repulse (5,40,3): | 0.4900 | |
| ROCnROLL: | 1 | |
| TRIX (15,9): | 0.0700 | |
| Courbe Coppock: | 3.83 |
| MA7: | 8.21 | |
| MA20: | 8.15 | |
| MA50: | 8.52 | |
| MA100: | 8.23 | |
| MAexp7: | 8.36 | |
| MAexp20: | 8.29 | |
| MAexp50: | 8.22 | |
| MAexp100: | 8.19 | |
| Price / MA7: | +3.05% | |
| Price / MA20: | +3.80% | |
| Price / MA50: | -0.70% | |
| Price / MA100: | +2.79% | |
| Price / MAexp7: | +1.20% | |
| Price / MAexp20: | +2.05% | |
| Price / MAexp50: | +2.92% | |
| Price / MAexp100: | +3.30% |
News
The last news published on METROVACESA, S.A. at the time of the generation of this analysis was as follows:
About author
Online


Add a comment
Comments
0 comments on the analysis METROVACESA, S.A. - 1H