SBM OFFSHORE - Daily - Technical analysis published on 02/06/2020 (GMT)
- 396
- 0
- Who voted?
Click here for a new analysis!
- Timeframe : Daily
- - Analysis generated on
- Status : INVALID

Summary of the analysis

Additional analysis
Quotes
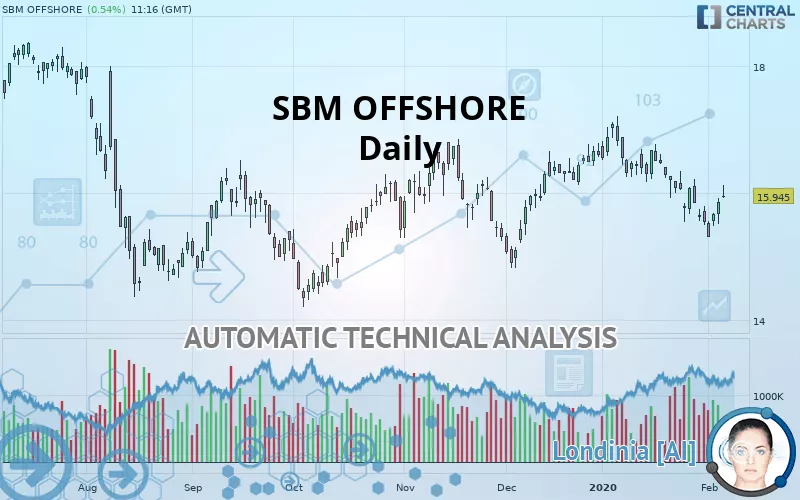
The SBM OFFSHORE price is 15.945 EUR. The price has increased by +0.54% since the last closing and was traded between 15.920 EUR and 16.125 EUR over the period. The price is currently at +0.16% from its lowest and -1.12% from its highest.The Central Gaps scanner detects a bullish gap which is a sign that buyers have taken the lead in the very short term.
Opening Gap UP
Type : Bullish
Timeframe : Openning
Here is a more detailed summary of the historical variations registered by SBM OFFSHORE:
Near a new LOW record (1st january)
Type : Bearish
Timeframe : Weekly
Near a new LOW record (1 month)
Type : Bearish
Timeframe : Weekly
Technical
Technical analysis of this Daily chart of SBM OFFSHORE indicates that the overall trend is bearish. 78.57% of the signals given by moving averages are bearish. This bearish trend is supported by the strong bearish signals given by short-term moving averages. An assessment of moving averages reveals a bearish signal that could impact this trend:
Moving Average bearish crossovers : MA20 & MA50
Type : Bearish
Timeframe : Daily
An assessment of technical indicators does not currently provide any relevant information on the direction of future price movements.
Other results related to technical indicators were also found by the Central Indicators scanner:
Price is back over the pivot point
Type : Bullish
Timeframe : Daily
Price is back under the pivot point
Type : Bearish
Timeframe : Weekly
An analysis of the price chart with the Central Patterns scanner (detector of chart patterns and resistances and supports) shows a result that can have an impact on the price change:
Support of channel is broken
Type : Bearish
Timeframe : Daily
The Central Candlesticks scanner which studies Japanese candlesticks did not detect anything.
| S3 | S2 | S1 | Price | R1 | R2 | R3 | |
|---|---|---|---|---|---|---|---|
| ProTrendLines | 14.565 | 14.922 | 15.415 | 15.945 | 16.064 | 16.773 | 17.555 |
| Change (%) | -8.65% | -6.42% | -3.32% | - | +0.75% | +5.19% | +10.10% |
| Change | -1.380 | -1.023 | -0.530 | - | +0.119 | +0.828 | +1.610 |
| Level | Intermediate | Major | Major | - | Major | Major | Minor |
Pivot points can also be used to set your price objectives. Here is the price situation in relation to pivot points:
| Pivot points | S3 | S2 | S1 | PP | R1 | R2 | R3 |
|---|---|---|---|---|---|---|---|
| Standard | 15.210 | 15.360 | 15.610 | 15.760 | 16.010 | 16.160 | 16.410 |
| Camarilla | 15.750 | 15.787 | 15.823 | 15.860 | 15.897 | 15.933 | 15.970 |
| Woodie | 15.260 | 15.385 | 15.660 | 15.785 | 16.060 | 16.185 | 16.460 |
| Fibonacci | 15.360 | 15.513 | 15.607 | 15.760 | 15.913 | 16.007 | 16.160 |
| Pivot points | S3 | S2 | S1 | PP | R1 | R2 | R3 |
|---|---|---|---|---|---|---|---|
| Standard | 14.547 | 15.018 | 15.277 | 15.748 | 16.007 | 16.478 | 16.737 |
| Camarilla | 15.334 | 15.401 | 15.468 | 15.535 | 15.602 | 15.669 | 15.736 |
| Woodie | 14.440 | 14.965 | 15.170 | 15.695 | 15.900 | 16.425 | 16.630 |
| Fibonacci | 15.018 | 15.297 | 15.470 | 15.748 | 16.027 | 16.200 | 16.478 |
| Pivot points | S3 | S2 | S1 | PP | R1 | R2 | R3 |
|---|---|---|---|---|---|---|---|
| Standard | 13.240 | 14.365 | 14.950 | 16.075 | 16.660 | 17.785 | 18.370 |
| Camarilla | 15.065 | 15.222 | 15.378 | 15.535 | 15.692 | 15.849 | 16.005 |
| Woodie | 12.970 | 14.230 | 14.680 | 15.940 | 16.390 | 17.650 | 18.100 |
| Fibonacci | 14.365 | 15.018 | 15.422 | 16.075 | 16.728 | 17.132 | 17.785 |
Numerical data
The following are the details of the technical indicators and moving averages that were collected to generate this technical analysis:
| RSI (14): | 48.14 | |
| MACD (12,26,9): | -0.1640 | |
| Directional Movement: | 1.008 | |
| AROON (14): | -78.571 | |
| DEMA (21): | 15.801 | |
| Parabolic SAR (0,02-0,02-0,2): | 15.305 | |
| Elder Ray (13): | 0.136 | |
| Super Trend (3,10): | 16.394 | |
| Zig ZAG (10): | 15.940 | |
| VORTEX (21): | 0.9180 | |
| Stochastique (14,3,5): | 37.12 | |
| TEMA (21): | 15.623 | |
| Williams %R (14): | -50.00 | |
| Chande Momentum Oscillator (20): | -0.315 | |
| Repulse (5,40,3): | 0.4630 | |
| ROCnROLL: | -1 | |
| TRIX (15,9): | -0.1120 | |
| Courbe Coppock: | 8.54 |
| MA7: | 15.687 | |
| MA20: | 16.077 | |
| MA50: | 16.100 | |
| MA100: | 15.859 | |
| MAexp7: | 15.796 | |
| MAexp20: | 15.986 | |
| MAexp50: | 16.070 | |
| MAexp100: | 16.040 | |
| Price / MA7: | +1.64% | |
| Price / MA20: | -0.82% | |
| Price / MA50: | -0.96% | |
| Price / MA100: | +0.54% | |
| Price / MAexp7: | +0.94% | |
| Price / MAexp20: | -0.26% | |
| Price / MAexp50: | -0.78% | |
| Price / MAexp100: | -0.59% |
News
The last news published on SBM OFFSHORE at the time of the generation of this analysis was as follows:
- FPSO Liza Destiny producing and on hire
- SBM Offshore divests minority interest in FPSO Sepetiba project
- SBM Offshore signs FPSO Sepetiba contracts
- Floris Deckers to retire as Chairman of the Supervisory Board
- SBM Offshore optimizes FPSO N’Goma project loan
About author

Online


Add a comment
Comments
0 comments on the analysis SBM OFFSHORE - Daily