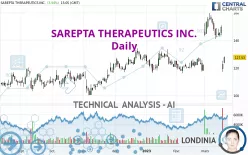
SAREPTA THERAPEUTICS INC. - Daily - Technical analysis published on 03/20/2023 (GMT)
- 152
- 0
- Timeframe : Daily
- - Analysis generated on
- Status : NEUTRAL
Summary of the analysis

Additional analysis
Quotes
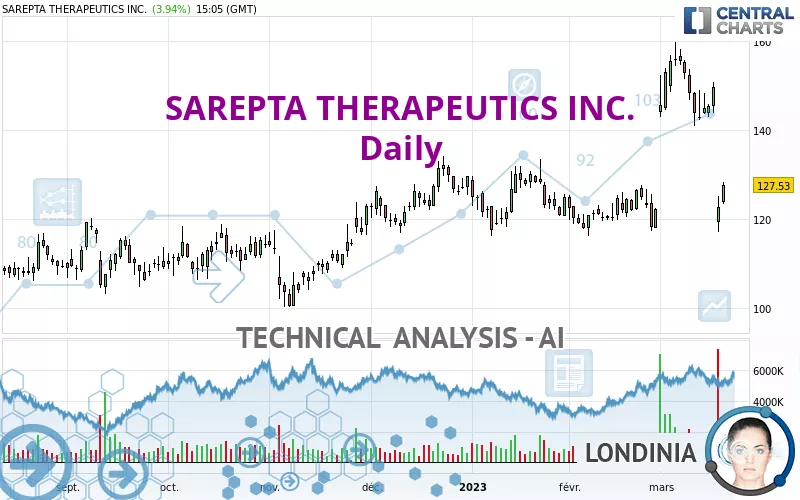
The SAREPTA THERAPEUTICS INC. rating is 127.53 USD. The price has increased by +3.95% since the last closing and was between 123.30 USD and 128.26 USD. This implies that the price is at +3.43% from its lowest and at -0.57% from its highest.The Central Gaps scanner detects a bullish opening marking the presence of buyers ahead of sellers at the opening but not sufficiently marked to allow the price to register a quotation gap.
Bullish opening
Type : Bullish
Timeframe : Openning
So that you have an overall view of the price change, here is a table showing the variations over several periods:
Abnormal volumes
Timeframe : 5 days
Abnormal volumes
Timeframe : 20 days
Technical
Technical analysis of this Daily chart of SAREPTA THERAPEUTICS INC. indicates that the overall trend is slightly bullish. 60.71% of the signals given by moving averages are bullish. Caution: the slightly bearish signals currently given by short-term moving averages indicate that this slightly bullish trend could be reversed. The Central Indicators market scanner is currently detecting several bearish and bullish signals that could impact this trend:
Bearish trend reversal : adaptative moving average 20
Type : Bearish
Timeframe : Daily
Bearish trend reversal : adaptative moving average 50
Type : Bearish
Timeframe : Daily
Bullish price crossover with Moving Average 100
Type : Bullish
Timeframe : Daily
In fact, only 9 technical indicators out of 18 studied are currently positioned bearish. Central Indicators, the scanner specialised in technical indicators, has identified these signals:
Pivot points : price is over resistance 1
Type : Neutral
Timeframe : Daily
Ichimoku : price is over the cloud
Type : Bullish
Timeframe : Daily
The analysis of the price chart with Central Patterns scanners does not return any result.
The Central Candlesticks scanner which studies Japanese candlesticks did not detect anything.
| S3 | S2 | S1 | Price | R1 | R2 | R3 | |
|---|---|---|---|---|---|---|---|
| ProTrendLines | 82.35 | 99.00 | 117.88 | 127.53 | 135.58 | 161.51 | 178.74 |
| Change (%) | -35.43% | -22.37% | -7.57% | - | +6.31% | +26.64% | +40.16% |
| Change | -45.18 | -28.53 | -9.65 | - | +8.05 | +33.98 | +51.21 |
| Level | Minor | Major | Major | - | Major | Major | Major |
To determine price objectives, it is also possible to use the pivot points. Here is the price position in relation to pivot points:
| Pivot points | S3 | S2 | S1 | PP | R1 | R2 | R3 |
|---|---|---|---|---|---|---|---|
| Standard | 110.20 | 113.66 | 118.17 | 121.63 | 126.14 | 129.60 | 134.11 |
| Camarilla | 120.50 | 121.23 | 121.96 | 122.69 | 123.42 | 124.15 | 124.88 |
| Woodie | 110.74 | 113.92 | 118.71 | 121.89 | 126.68 | 129.86 | 134.65 |
| Fibonacci | 113.66 | 116.70 | 118.58 | 121.63 | 124.67 | 126.55 | 129.60 |
| Pivot points | S3 | S2 | S1 | PP | R1 | R2 | R3 |
|---|---|---|---|---|---|---|---|
| Standard | 75.91 | 96.51 | 109.60 | 130.20 | 143.29 | 163.89 | 176.98 |
| Camarilla | 113.43 | 116.51 | 119.60 | 122.69 | 125.78 | 128.87 | 131.96 |
| Woodie | 72.16 | 94.63 | 105.85 | 128.32 | 139.54 | 162.01 | 173.23 |
| Fibonacci | 96.51 | 109.38 | 117.33 | 130.20 | 143.07 | 151.02 | 163.89 |
| Pivot points | S3 | S2 | S1 | PP | R1 | R2 | R3 |
|---|---|---|---|---|---|---|---|
| Standard | 105.08 | 110.66 | 116.40 | 121.98 | 127.72 | 133.30 | 139.04 |
| Camarilla | 119.02 | 120.06 | 121.09 | 122.13 | 123.17 | 124.21 | 125.24 |
| Woodie | 105.15 | 110.70 | 116.47 | 122.02 | 127.79 | 133.34 | 139.11 |
| Fibonacci | 110.66 | 114.99 | 117.66 | 121.98 | 126.31 | 128.98 | 133.30 |
Numerical data
The following are the details of the technical indicators and moving averages that were collected to generate this technical analysis:
| RSI (14): | 42.43 | |
| MACD (12,26,9): | 2.5700 | |
| Directional Movement: | -10.81 | |
| AROON (14): | -64.29 | |
| DEMA (21): | 142.33 | |
| Parabolic SAR (0,02-0,02-0,2): | 158.99 | |
| Elder Ray (13): | -13.27 | |
| Super Trend (3,10): | 147.80 | |
| Zig ZAG (10): | 127.10 | |
| VORTEX (21): | 0.9500 | |
| Stochastique (14,3,5): | 37.57 | |
| TEMA (21): | 141.86 | |
| Williams %R (14): | -74.85 | |
| Chande Momentum Oscillator (20): | -25.09 | |
| Repulse (5,40,3): | 8.1900 | |
| ROCnROLL: | 2 | |
| TRIX (15,9): | 0.6000 | |
| Courbe Coppock: | 17.22 |
| MA7: | 139.58 | |
| MA20: | 139.03 | |
| MA50: | 129.46 | |
| MA100: | 123.52 | |
| MAexp7: | 137.44 | |
| MAexp20: | 137.90 | |
| MAexp50: | 131.76 | |
| MAexp100: | 124.49 | |
| Price / MA7: | -8.63% | |
| Price / MA20: | -8.27% | |
| Price / MA50: | -1.49% | |
| Price / MA100: | +3.25% | |
| Price / MAexp7: | -7.21% | |
| Price / MAexp20: | -7.52% | |
| Price / MAexp50: | -3.21% | |
| Price / MAexp100: | +2.44% |
News
The last news published on SAREPTA THERAPEUTICS INC. at the time of the generation of this analysis was as follows:
- EQUITY ALERT: ROSEN, A TOP RANKED LAW FIRM, Encourages Sarepta Therapeutics, Inc. Investors to Inquire About Securities Class Action Investigation – SRPT
- Sarepta Therapeutics Announces Advisory Committee Meeting will be Held for SRP-9001
- Sarepta Therapeutics Announces Inducement Grants Under Nasdaq Listing Rule 5635(c)(4)
- Sarepta Therapeutics Announces Fourth Quarter and Full-Year 2022 Financial Results and Recent Corporate Developments
- Sarepta Therapeutics Announces Call for Applications for the 6th Annual Route 79, The Duchenne Scholarship Program
About author

Online


Add a comment
Comments
0 comments on the analysis SAREPTA THERAPEUTICS INC. - Daily