SALLY BEAUTY HLD. - Daily - Technical analysis published on 12/27/2019 (GMT)
- 311
- 0
- Who voted?
Click here for a new analysis!
- Timeframe : Daily
- - Analysis generated on
- Status : INVALID

Summary of the analysis

Additional analysis
Quotes
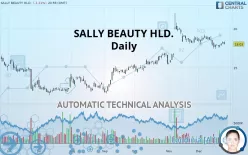
SALLY BEAUTY HLD. rating 18.03 USD. The price is lower by -1.21% since the last closing with the lowest point at 17.96 USD and the highest point at 18.37 USD. The deviation from the price is +0.39% for the low point and -1.85% for the high point.The Central Gaps scanner detects the formation of a bearish gap marking the strong presence of sellers ahead of buyers at the opening. This formed a quotation gap.
Opening Gap DOWN
Type : Bearish
Timeframe : Openning
Here is a more detailed summary of the historical variations registered by SALLY BEAUTY HLD.:
Technical
Technical analysis of this Daily chart of SALLY BEAUTY HLD. indicates that the overall trend is bullish. 71.43% of the signals given by moving averages are bullish. Caution: the neutral signals currently given by the short-term moving averages indicate that this bullish trend is showing signs of running out of steam. The Central Indicators scanner detects a bearish signal on moving averages that could impact this trend:
Bearish price crossover with adaptative moving average 50
Type : Bearish
Timeframe : Daily
An assessment of technical indicators does not currently provide any relevant information to suggest whether the signal given by the technical indicators is more bullish or bearish.
But beware of excesses. The Central Indicators scanner currently detects this:
Williams %R indicator is overbought : over -20
Type : Neutral
Timeframe : Daily
Pivot points : price is under support 1
Type : Neutral
Timeframe : Daily
RSI indicator is back under 50
Type : Bearish
Timeframe : Daily
MACD indicator is back under 0
Type : Bearish
Timeframe : Daily
Price is back over the pivot point
Type : Bullish
Timeframe : Daily
No signals are given by Central Patterns, a market scanner specialised in chart patterns, resistances and supports.
The Central Candlesticks scanner, specialised in Japanese candlesticks, did not identify any signals.
| S3 | S2 | S1 | Price | R1 | R2 | R3 | |
|---|---|---|---|---|---|---|---|
| ProTrendLines | 13.89 | 15.91 | 17.43 | 18.03 | 19.44 | 22.62 | 28.07 |
| Change (%) | -22.96% | -11.76% | -3.33% | - | +7.82% | +25.46% | +55.68% |
| Change | -4.14 | -2.12 | -0.60 | - | +1.41 | +4.59 | +10.04 |
| Level | Major | Minor | Major | - | Major | Major | Intermediate |
Attention could also be paid to pivot points to set price objectives:
| Pivot points | S3 | S2 | S1 | PP | R1 | R2 | R3 |
|---|---|---|---|---|---|---|---|
| Standard | 17.76 | 17.90 | 18.08 | 18.22 | 18.40 | 18.54 | 18.72 |
| Camarilla | 18.16 | 18.19 | 18.22 | 18.25 | 18.28 | 18.31 | 18.34 |
| Woodie | 17.77 | 17.91 | 18.09 | 18.23 | 18.41 | 18.55 | 18.73 |
| Fibonacci | 17.90 | 18.03 | 18.10 | 18.22 | 18.35 | 18.42 | 18.54 |
| Pivot points | S3 | S2 | S1 | PP | R1 | R2 | R3 |
|---|---|---|---|---|---|---|---|
| Standard | 16.68 | 17.06 | 17.44 | 17.82 | 18.20 | 18.58 | 18.96 |
| Camarilla | 17.62 | 17.69 | 17.76 | 17.83 | 17.90 | 17.97 | 18.04 |
| Woodie | 16.69 | 17.06 | 17.45 | 17.82 | 18.21 | 18.58 | 18.97 |
| Fibonacci | 17.06 | 17.35 | 17.53 | 17.82 | 18.11 | 18.29 | 18.58 |
| Pivot points | S3 | S2 | S1 | PP | R1 | R2 | R3 |
|---|---|---|---|---|---|---|---|
| Standard | 8.62 | 12.00 | 15.22 | 18.60 | 21.82 | 25.20 | 28.42 |
| Camarilla | 16.63 | 17.23 | 17.84 | 18.44 | 19.05 | 19.65 | 20.26 |
| Woodie | 8.54 | 11.96 | 15.14 | 18.56 | 21.74 | 25.16 | 28.34 |
| Fibonacci | 12.00 | 14.52 | 16.08 | 18.60 | 21.12 | 22.68 | 25.20 |
Numerical data
The following is the status of technical indicators and moving averages registered at the time this technical analysis was created:
| RSI (14): | 48.62 | |
| MACD (12,26,9): | 0.0000 | |
| Directional Movement: | 1.60 | |
| AROON (14): | -50.00 | |
| DEMA (21): | 18.24 | |
| Parabolic SAR (0,02-0,02-0,2): | 19.22 | |
| Elder Ray (13): | 0.04 | |
| Super Trend (3,10): | 19.31 | |
| Zig ZAG (10): | 18.03 | |
| VORTEX (21): | 0.9500 | |
| Stochastique (14,3,5): | 37.59 | |
| TEMA (21): | 17.86 | |
| Williams %R (14): | -66.67 | |
| Chande Momentum Oscillator (20): | -0.65 | |
| Repulse (5,40,3): | 0.3300 | |
| ROCnROLL: | -1 | |
| TRIX (15,9): | 0.0600 | |
| Courbe Coppock: | 6.99 |
| MA7: | 17.96 | |
| MA20: | 18.32 | |
| MA50: | 17.83 | |
| MA100: | 15.86 | |
| MAexp7: | 18.05 | |
| MAexp20: | 18.17 | |
| MAexp50: | 17.61 | |
| MAexp100: | 16.67 | |
| Price / MA7: | +0.39% | |
| Price / MA20: | -1.58% | |
| Price / MA50: | +1.12% | |
| Price / MA100: | +13.68% | |
| Price / MAexp7: | -0.11% | |
| Price / MAexp20: | -0.77% | |
| Price / MAexp50: | +2.39% | |
| Price / MAexp100: | +8.16% |
News
The latest news and videos published on SALLY BEAUTY HLD. at the time of the analysis were as follows:
- P&G's My Black is Beautiful Platform Launches a New Haircare Line in Partnership with Sally Beauty
- Sally Beauty Launches New Mobile App in Support of 15 Million Loyalty Members
- Hayley Williams' Brand, Good Dye Young, To Launch Nationwide At Sally Beauty
- Sally Beauty Commences Tender Offers for Senior Notes
- Sally Beauty Transforms Loyalty Program And Unveils Sally Beauty Rewards
About author

Online


Add a comment
Comments
0 comments on the analysis SALLY BEAUTY HLD. - Daily