ARPA - ARPA/USD
0.005378
USD
(+0.58%)
04/30/2025 - 17:46
Open Real time data - CoinMarketCap
| Open: | 0.005369 |
| Change: | +0.000031 |
| Volume: | 0 |
| Low: | 0.005330 |
| High: | 0.005477 |
| High / Low range: | 0.000147 |
| Type: | Cryptocurrencies |
| Ticker: | ARPAUSD |
| ISIN: |
ARPA - ARPA/USD overview
ARPA - ARPA/USD
> Analyses11/15/2024 - 19:20

 Thank you
Reply
Chart
Thank you
Reply
Chart
Londinia
has published a new analysis.
- 0
- 94.5k
- 15.8k
- 0
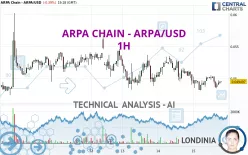
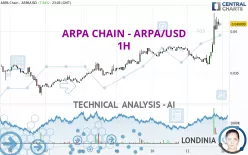
Timeframe : 1H - Simple chart
Status : INVALID
The bearish basic trend is very strong on ARPA CHAIN - ARPA/USD but the short term shows some signs of running out of steam. However, a sale could be considered as long as the price remains below…
ARPA - ARPA/USD
> Analyses10/25/2024 - 00:20
 Thank you
Reply
Chart
Thank you
Reply
Chart
Londinia
has published a new analysis.
- 0
- 94.5k
- 15.8k
- 0
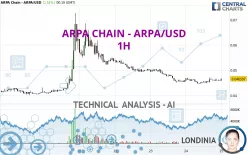
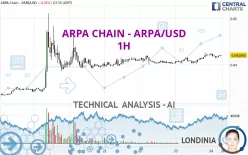
Timeframe : 1H - Simple chart
Status : INVALID
We are currently in a phase of short-term indecision. In a case like this, you could favour trades in the direction of the basic trend on ARPA CHAIN - ARPA/USD. As long as you are under the resistance…
ARPA - ARPA/USD
> Analyses09/24/2024 - 06:15
 Thank you
Reply
Chart
Thank you
Reply
Chart
Londinia
has published a new analysis.
- 0
- 94.5k
- 15.8k
- 0
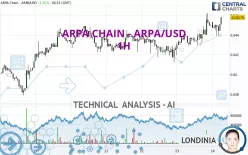
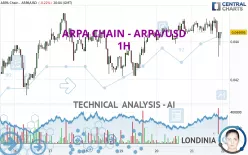
Timeframe : 1H - Simple chart
Status : LEVEL MAINTAINED
All elements being clearly bullish, it would be possible for traders to trade only long positions (at the time of purchase) on ARPA CHAIN - ARPA/USD as long as the price remains well above 0.044895…
ARPA - ARPA/USD
> Analyses09/21/2024 - 23:15
 Thank you
Reply
Chart
Thank you
Reply
Chart
Londinia
has published a new analysis.
- 0
- 94.5k
- 15.8k
- 0
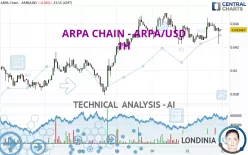
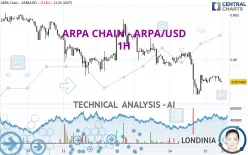
Timeframe : 1H - Simple chart
Status : LEVEL MAINTAINED
A bullish trend on ARPA CHAIN - ARPA/USD both in substance and in the short term. A purchase could be considered as long as the price remains above 0.041862 USD. Each resistance break is a strong…
ARPA - ARPA/USD
> Analyses09/11/2024 - 23:05
 Thank you
Reply
Chart
Thank you
Reply
Chart
Londinia
has published a new analysis.
- 0
- 94.5k
- 15.8k
- 0
Timeframe : 1H - Simple chart
Status : TARGET REACHED
ARPA CHAIN - ARPA/USD is part of a very strong bullish trend. Traders may consider trading only long positions (at the time of purchase) as long as the price remains well above 0.038855 USD. The next…
ARPA - ARPA/USD
> Analyses08/24/2024 - 07:15
 Thank you
Reply
Chart
Thank you
Reply
Chart
Londinia
has published a new analysis.
- 0
- 94.5k
- 15.8k
- 0
Timeframe : 1H - Simple chart
Status : TARGET REACHED
ARPA CHAIN - ARPA/USD is part of a very strong bullish trend. Traders may consider trading only long positions (at the time of purchase) as long as the price remains well above 0.041740 USD. The next…
ARPA - ARPA/USD
> Analyses07/21/2024 - 20:05
 Thank you
Reply
Chart
Thank you
Reply
Chart
Londinia
has published a new analysis.
- 0
- 94.5k
- 15.8k
- 0
Timeframe : 1H - Simple chart
Status : INVALID
With a bullish background trend, the price of ARPA CHAIN - ARPA/USD is trying to inflate a little with a slight short-term relapse. At this stage, no trend reversal is in sight. Globally, buyers have…
ARPA - ARPA/USD
> Analyses06/15/2024 - 11:25
 Thank you
Reply
Chart
Thank you
Reply
Chart
Londinia
has published a new analysis.
- 0
- 94.5k
- 15.8k
- 0
Timeframe : 1H - Simple chart
Status : LEVEL MAINTAINED
The bearish trend is currently very strong for ARPA CHAIN - ARPA/USD. As long as the price remains below the resistance at 0.058164 USD, you could try to take advantage of the bearish rally. The first…

