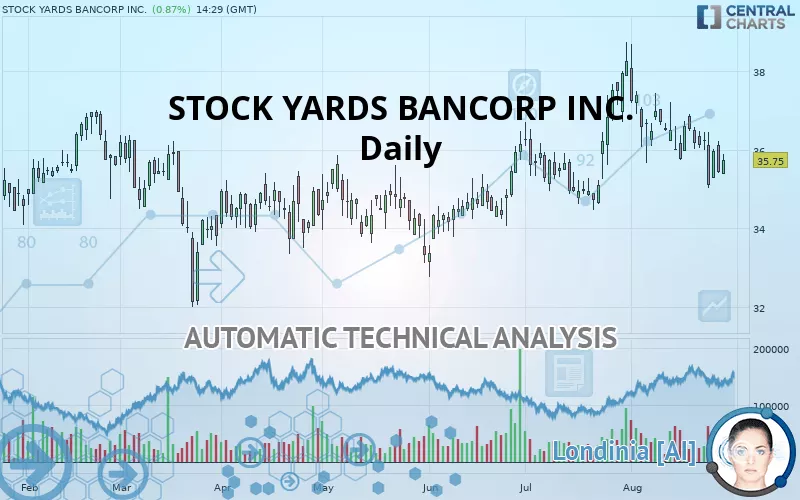
STOCK YARDS BANCORP INC. - Daily - Technical analysis published on 08/28/2019 (GMT)
- 287
- 0
- Who voted?
Click here for a new analysis!
- Timeframe : Daily
- - Analysis generated on
- Status : TARGET REACHED

Summary of the analysis

Additional analysis
Quotes
The STOCK YARDS BANCORP INC. rating is 35.75 USD. On the day, this instrument gained +0.88% and was traded between 35.38 USD and 35.90 USD over the period. The price is currently at +1.05% from its lowest and -0.42% from its highest.A bearish gap was detected at the opening by the Central Gaps scanner. There are a lot of sellers and they have the upper hand in the very short term.
Opening Gap DOWN
Type : Bearish
Timeframe : Openning
So that you have an overall view of the price change, here is a table showing the variations over several periods:
Near a new LOW record (1 month)
Type : Bearish
Timeframe : Weekly
Technical
A technical analysis in Daily of this STOCK YARDS BANCORP INC. chart shows a slightly bullish trend. 57.14% of the signals given by moving averages are bullish. Caution: the strong bearish signals currently given by short-term moving averages indicate that a trend reversal may be taking place. The Central Indicators market scanner is currently detecting several bearish signals that could impact this trend:
Bearish price crossover with Moving Average 50
Type : Bearish
Timeframe : Daily
Bearish price crossover with adaptative moving average 50
Type : Bearish
Timeframe : Daily
In fact, according to the parameters integrated into the Central Analyzer system, only 9 technical indicators out of 18 analysed are currently bearish. Caution: the Central Indicators scanner currently detects an excess:
CCI indicator is oversold : under -100
Type : Neutral
Timeframe : Daily
Williams %R indicator is oversold : under -80
Type : Neutral
Timeframe : Daily
Pivot points : price is under support 1
Type : Neutral
Timeframe : Daily
Price is back under the pivot point
Type : Bearish
Timeframe : Weekly
Central Patterns, the market scanner focusing on chart patterns, resistances and supports found this result:
Near horizontal resistance
Type : Bearish
Timeframe : Daily
For a small setback in the very short term, the Central Candlesticks scanner currently notes the presence of this bearish pattern in Japanese candlesticks:
Dark cloud cover
Type : Bearish
Timeframe : Daily
| S3 | S2 | S1 | Price | R1 | R2 | R3 | |
|---|---|---|---|---|---|---|---|
| ProTrendLines | 32.21 | 34.76 | 35.66 | 35.75 | 36.95 | 38.80 | 41.60 |
| Change (%) | -9.90% | -2.77% | -0.25% | - | +3.36% | +8.53% | +16.36% |
| Change | -3.54 | -0.99 | -0.09 | - | +1.20 | +3.05 | +5.85 |
| Level | Major | Major | Intermediate | - | Major | Major | Intermediate |
To determine price objectives, it is also possible to use the pivot points. Here is the price position in relation to pivot points:
| Pivot points | S3 | S2 | S1 | PP | R1 | R2 | R3 |
|---|---|---|---|---|---|---|---|
| Standard | 34.34 | 34.87 | 35.16 | 35.69 | 35.98 | 36.51 | 36.80 |
| Camarilla | 35.21 | 35.29 | 35.37 | 35.44 | 35.52 | 35.59 | 35.67 |
| Woodie | 34.21 | 34.81 | 35.03 | 35.63 | 35.85 | 36.45 | 36.67 |
| Fibonacci | 34.87 | 35.19 | 35.38 | 35.69 | 36.01 | 36.20 | 36.51 |
| Pivot points | S3 | S2 | S1 | PP | R1 | R2 | R3 |
|---|---|---|---|---|---|---|---|
| Standard | 32.58 | 33.80 | 34.46 | 35.68 | 36.34 | 37.56 | 38.22 |
| Camarilla | 34.59 | 34.77 | 34.94 | 35.11 | 35.28 | 35.46 | 35.63 |
| Woodie | 32.29 | 33.66 | 34.17 | 35.54 | 36.05 | 37.42 | 37.93 |
| Fibonacci | 33.80 | 34.52 | 34.97 | 35.68 | 36.40 | 36.85 | 37.56 |
| Pivot points | S3 | S2 | S1 | PP | R1 | R2 | R3 |
|---|---|---|---|---|---|---|---|
| Standard | 31.30 | 32.88 | 35.57 | 37.15 | 39.84 | 41.42 | 44.11 |
| Camarilla | 37.08 | 37.47 | 37.86 | 38.25 | 38.64 | 39.03 | 39.42 |
| Woodie | 31.85 | 33.16 | 36.12 | 37.43 | 40.39 | 41.70 | 44.66 |
| Fibonacci | 32.88 | 34.51 | 35.52 | 37.15 | 38.78 | 39.79 | 41.42 |
Numerical data
The following are the details of the technical indicators and moving averages that were collected to generate this technical analysis:
| RSI (14): | 48.04 | |
| MACD (12,26,9): | -0.1100 | |
| Directional Movement: | -5.87 | |
| AROON (14): | -78.57 | |
| DEMA (21): | 36.07 | |
| Parabolic SAR (0,02-0,02-0,2): | 37.03 | |
| Elder Ray (13): | -0.40 | |
| Super Trend (3,10): | 37.89 | |
| Zig ZAG (10): | 35.90 | |
| VORTEX (21): | 0.8600 | |
| Stochastique (14,3,5): | 32.05 | |
| TEMA (21): | 35.74 | |
| Williams %R (14): | -60.27 | |
| Chande Momentum Oscillator (20): | -0.59 | |
| Repulse (5,40,3): | -0.2800 | |
| ROCnROLL: | 2 | |
| TRIX (15,9): | 0.0200 | |
| Courbe Coppock: | 5.62 |
| MA7: | 35.94 | |
| MA20: | 36.35 | |
| MA50: | 35.95 | |
| MA100: | 35.24 | |
| MAexp7: | 35.85 | |
| MAexp20: | 36.12 | |
| MAexp50: | 35.91 | |
| MAexp100: | 35.49 | |
| Price / MA7: | -0.53% | |
| Price / MA20: | -1.65% | |
| Price / MA50: | -0.56% | |
| Price / MA100: | +1.45% | |
| Price / MAexp7: | -0.28% | |
| Price / MAexp20: | -1.02% | |
| Price / MAexp50: | -0.45% | |
| Price / MAexp100: | +0.73% |
News
The last news published on STOCK YARDS BANCORP INC. at the time of the generation of this analysis was as follows:
- Stock Yards Bancorp Declares Quarterly Cash Dividend of $0.25 Per Common Share
-
 Stock Yards Bancorp
-
Stock Yards Bancorp
About author

Online


Add a comment
Comments
0 comments on the analysis STOCK YARDS BANCORP INC. - Daily